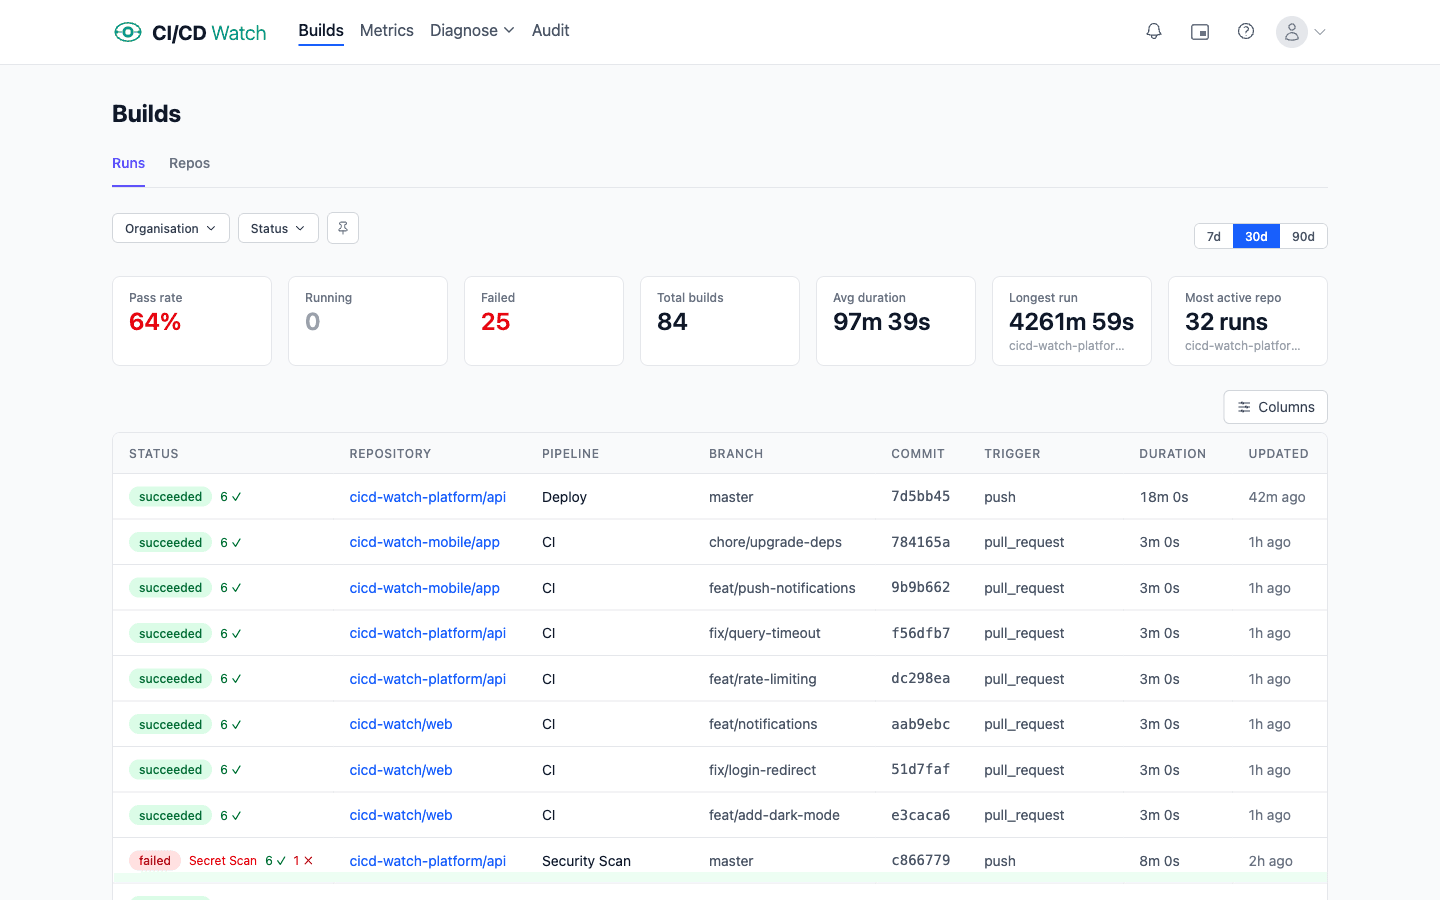
Monitor every CI/CD pipeline in one dashboard
The CI/CD observability platform. Connect GitHub, GitLab, Bitbucket, and more for instant visibility into pipeline health, DORA metrics, costs, and test reliability.
Built for teams who care about delivery
Whether you're tracking team performance, wrangling multiple providers, or hunting flaky tests, CI/CD Watch gives you the answers without the tab-switching.
Developers
Stop context-switching to check your builds
See if your branch is green, get notified when it breaks, and drill into test failures without leaving your workflow. Picture-in-Picture mode keeps your build status visible while you code.
- Real-time build status
- Picture-in-Picture mode
- Test failure drill-down
- Branch-level filtering
Engineering Managers
Know if your team is shipping well
Track DORA metrics across every team and repository. Spot degrading deployment frequency or rising change failure rates before they become a problem. Give leadership real numbers, not vibes.
- DORA metrics with trend charts
- Team-wide pipeline visibility
- Proactive degradation alerts
- Cost tracking and waste reports
Platform, DevOps & SRE
One pane of glass, zero blind spots
Consolidate GitHub Actions, GitLab CI, Bitbucket Pipelines, CircleCI, Azure DevOps, and Jenkins into a single dashboard. Classify every pipeline as healthy, flaky, or broken. See which repos are missing SAST, dependency, secret, and container scanning. Spot degrading build times before instability blocks deployments.
- Multi-provider consolidation
- Stability classification
- Security control coverage
- Optimisation suggestions
Tech Leads
Ship faster with less waste
See the real cost of CI: compute and developer time. Identify the pull requests blocked longest by failing pipelines, the repos with the most wasted runs, and the tests slowing everyone down.
- PR health and CI wait time
- Waste breakdown by category
- Cost optimisation opportunities
- Per-repo drill-downs
DevSecOps
DevSecOps observability, without another scanner
Inventory security control coverage across every repository. Find gaps in SAST, dependency scanning, secret scanning, container scanning, and SHA-pinning, then copy-paste the fixes. No new scanners.
- Control coverage inventory
- Stack-aware recommendations
- Action pinning detection
- Dismissals with structured reasons
Access your CI/CD data however you work
A dashboard when you want the full picture. An API for automation. An MCP server for AI-powered insights. A CLI for the terminal. Slack for real-time alerts.
Web Dashboard
Real-time monitoring, DORA metrics, cost tracking, stability analysis, and test results. All in your browser.
Public API
Query pipeline runs, DORA metrics, costs, and performance data programmatically. Build custom integrations.
MCP Server
Ask Claude, Cursor, or Windsurf about your pipelines. CI/CD insights in your AI assistant, grounded in real data.
CLI
Check pipeline status, rerun failed workflows, and stream build logs. All from your terminal.
Slack
Get notified when builds fail, deployments land, or alerts fire, in channels and DMs.
Up and running in three steps
No configuration files. No YAML. No webhooks to set up.
Connect Your Provider
Sign in with GitHub, GitLab, or Bitbucket via OAuth (or connect Jenkins, CircleCI, or Azure DevOps with an API token), and start monitoring your pipelines.
Pick Your Repos
Select which repositories and workflows you want to monitor.
Start Watching
See all your pipelines in one real-time dashboard. That's it.
Trusted by engineering teams
Ready to see your pipelines in one place?
Connect your CI/CD provider and start monitoring in under a minute. Free to get started.
Built by a team that manages CI/CD pipelines every day. Read the docs or check pricing.
Get Started Free