CI/CD Watch vs Sleuth
Sleuth alternative: more than deployment tracking
Sleuth tracks deployments and DORA metrics. CI/CD Watch monitors every pipeline run, with cost analysis, flaky test detection, stability classification, and performance ratings on top of DORA.
What is Sleuth?
Sleuth is a deployment-centric DORA metrics tracker that treats each deploy as a discrete event and connects it to issues, builds, and incidents. It tracks deployment frequency, change lead time, change failure rate, and mean time to recovery. Sleuth supports GitHub, GitLab, Bitbucket, CircleCI, and Jenkins via native integrations or webhooks. Through 2026 Sleuth has expanded toward AI developer tooling with its open-source SX distribution and enterprise Sleuth Skills, though the deployment-tracking DORA product remains available.
Feature comparison
How CI/CD Watch and Sleuth compare across key capabilities.
| Feature | CI/CD Watch | Sleuth |
|---|---|---|
| DORA metrics | ||
| Deployment tracking | ||
| Multi-provider pipeline dashboard | ||
| CI/CD cost estimation | ||
| Developer wait time tracking | ||
| Flaky test detection | ||
| Pipeline stability classification | ||
| Pipeline performance ratings | ||
| PR health tracking | ||
| Incident tracking | ||
| Deploy-to-incident correlation | ||
| CLI | ||
| MCP server (AI integration) | ||
| Slack App Home | ||
| Pipeline security insights | ||
| Pricing | From free | Free to 10 devs, then $25/dev/mo |
Why teams choose CI/CD Watch over Sleuth
Beyond deployments
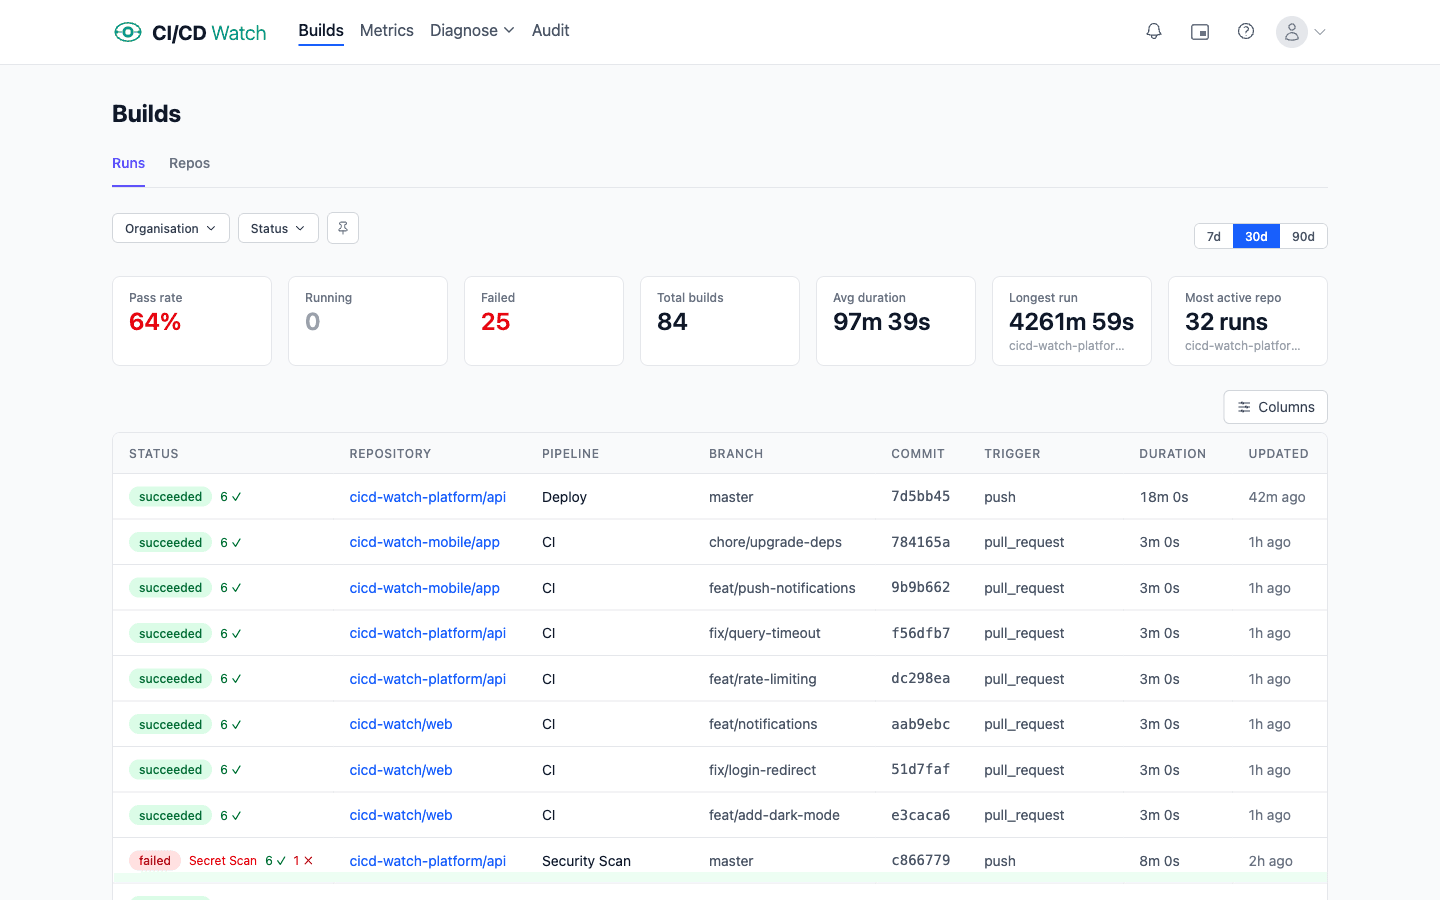
Sleuth tracks deployments and connects them to incidents. CI/CD Watch monitors every pipeline run — not just deploys — giving you visibility into build failures, flaky tests, and wasted compute across all branches and workflows.
CI/CD cost tracking
CI/CD Watch calculates compute costs, developer wait time, and waste categories for every pipeline run. Sleuth focuses on deployment velocity metrics without tracking the cost of your CI/CD infrastructure.
Flaky test detection
CI/CD Watch parses JUnit XML reports to surface flaky tests, track their stability, and estimate their cost impact. Sleuth doesn't analyse test results.
Pipeline stability and performance
Every pipeline gets a stability classification and performance rating with trend detection. Sleuth measures deployment outcomes but doesn't rate the health of individual pipelines or track duration trends.
Frequently asked questions
- What's the difference between Sleuth and CI/CD Watch?
- Sleuth is deployment-centric: it treats each deploy as a discrete event, tracks the four original DORA metrics, and connects deploys to incidents. CI/CD Watch monitors every pipeline run, not just deployments, adding build and test failures, flaky-test detection, compute-cost and developer-wait-time tracking, and stability and performance ratings on top of DORA. One honest gap: Sleuth does incident tracking and deploy-to-incident correlation that CI/CD Watch does not.
- Does CI/CD Watch track deployments like Sleuth?
- Yes. CI/CD Watch detects deployments and calculates deployment frequency, change lead time, change failure rate, and failed deployment recovery time, plus deployment rework rate. It does this alongside build, test, cost, and stability data from the same pipeline runs, rather than treating deployment tracking as a standalone product.
Other comparisons
See how CI/CD Watch compares to other tools in the CI/CD monitoring space.
Comparison based on publicly available information as of April 2026. Competitor products evolve — please check Sleuth's official site for their latest features and pricing.
Ready to try CI/CD Watch?
Free to get started. Connect your CI/CD providers and see your first dashboard in under a minute.