CI/CD Watch vs LinearB
LinearB alternative: CI/CD pipeline data, not just Git metrics
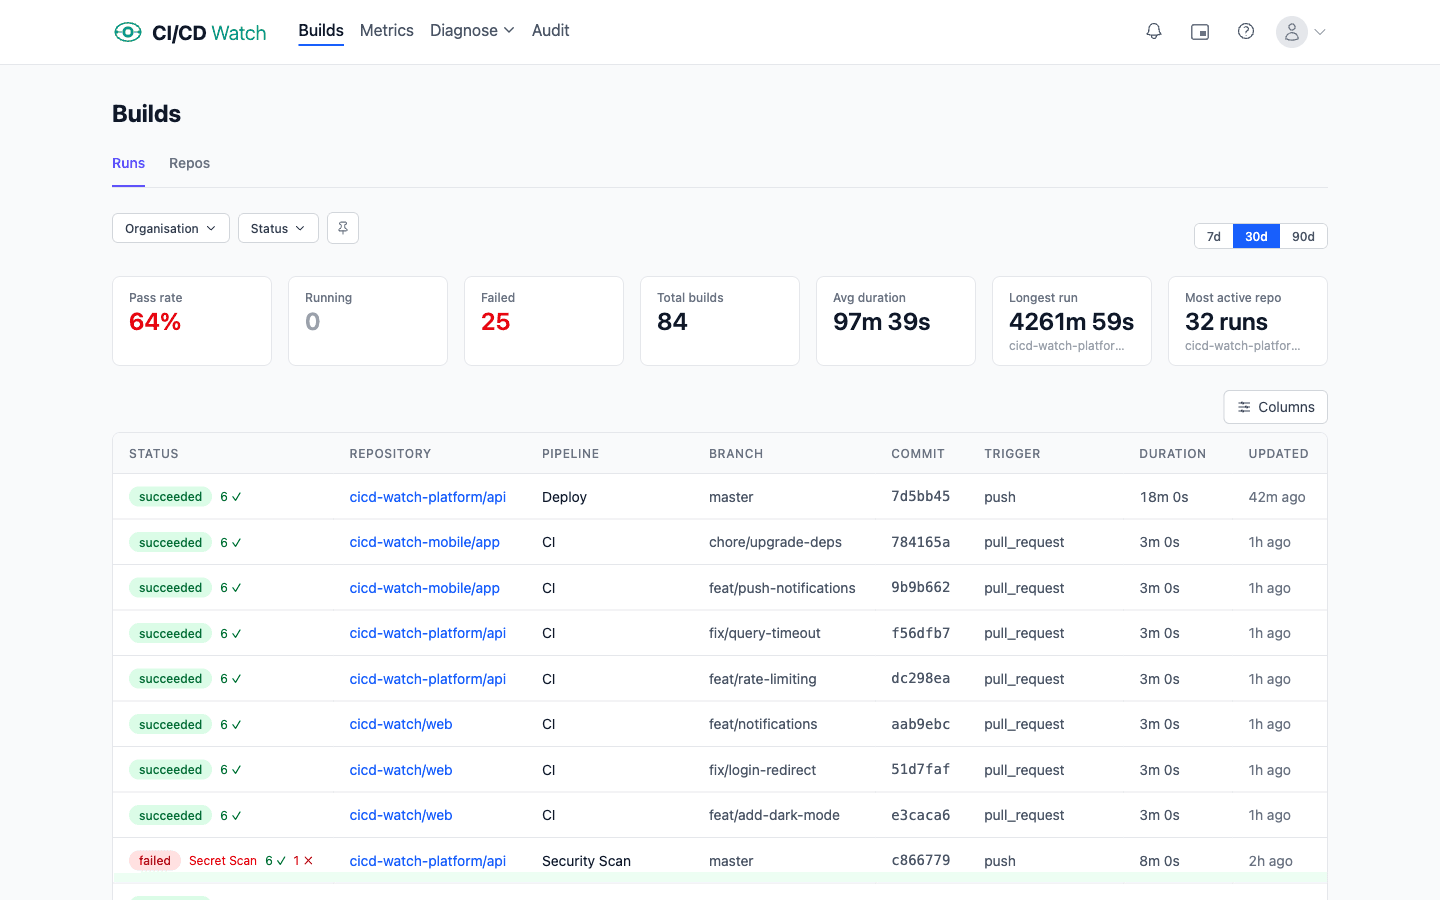
LinearB measures engineering velocity through Git activity and cycle time. CI/CD Watch monitors your actual pipelines: costs, stability, flaky tests, and DORA metrics from the CI/CD data itself.
What is LinearB?
LinearB is a software engineering intelligence platform that tracks DORA metrics, cycle time decomposition (coding, pickup, review, and deploy time), and PR workflow analytics. It offers gitStream for automated PR routing and benchmarks built from millions of pull requests. LinearB is Git-centric: it analyses pull request and commit data rather than CI/CD pipeline execution.
Feature comparison
How CI/CD Watch and LinearB compare across key capabilities.
| Feature | CI/CD Watch | LinearB |
|---|---|---|
| Multi-provider pipeline dashboard | ||
| DORA metrics | ||
| CI/CD cost estimation | ||
| Developer wait time tracking | ||
| Flaky test detection | ||
| Pipeline stability classification | ||
| Pipeline performance ratings | ||
| PR health tracking | Partial | |
| Cycle time decomposition | ||
| gitStream workflow automation | ||
| Industry benchmarks | ||
| CLI | ||
| MCP server (AI integration) | ||
| Jenkins / Azure DevOps support | ||
| Pipeline security insights | ||
| Pricing | From free | From $29/contributor/mo, billed annually |
Why teams choose CI/CD Watch over LinearB
Pipeline-centric, not just Git-centric
CI/CD Watch monitors actual pipeline execution — runs, durations, failures, costs. LinearB focuses on Git workflow metrics like cycle time and PR pickup time. If you need to know why builds fail and what they cost, CI/CD Watch gives you that data directly.
CI/CD cost tracking
CI/CD Watch calculates compute costs and developer wait time for every pipeline run. LinearB doesn't track CI/CD spending — it measures engineering velocity through Git activity, not pipeline economics.
Flaky test detection
CI/CD Watch parses JUnit XML reports to identify flaky tests, track their stability over time, and estimate their cost impact. LinearB doesn't analyse test results at all.
Broader provider support
CI/CD Watch monitors GitHub Actions, GitLab CI, Bitbucket Pipelines, CircleCI, Azure DevOps, and Jenkins. LinearB integrates with Git hosts but doesn't monitor CI/CD pipeline execution across all these providers.
Frequently asked questions
- How much does LinearB cost?
- LinearB's Essentials tier is $29 per contributor per month and Enterprise is $59 per contributor per month, both billed annually with no monthly option. For a 10-contributor team that is from $290/mo on Essentials, roughly ten times CI/CD Watch's flat $29/mo Team tier, which is priced per tenant rather than per contributor.
- Does LinearB monitor CI/CD pipelines?
- LinearB is Git-centric: it analyses pull-request and commit data for cycle time, PR pickup, and review time. It does not monitor CI/CD pipeline execution, so it will not show you build failures, run durations, or compute cost. CI/CD Watch reads the CI/CD data directly and reports on all three.
- Is CI/CD Watch a LinearB alternative for DORA metrics?
- Both track DORA metrics, but from different sources: CI/CD Watch derives them from pipeline and deployment data, while LinearB derives them from Git activity. LinearB adds cycle-time decomposition, gitStream workflow automation, and cross-industry benchmarks that CI/CD Watch does not. If your priority is pipeline execution, cost, and flaky tests, CI/CD Watch fits; if it is Git-workflow analytics, LinearB does.
Other comparisons
See how CI/CD Watch compares to other tools in the CI/CD monitoring space.
Comparison based on publicly available information as of April 2026. Competitor products evolve — please check LinearB's official site for their latest features and pricing.
Ready to try CI/CD Watch?
Free to get started. Connect your CI/CD providers and see your first dashboard in under a minute.