Your CI/CD pipelines, one dashboard
Monitor every pipeline run across GitHub, GitLab, Bitbucket, CircleCI, Azure DevOps, and Jenkins. Track DORA metrics, spot flaky builds, and get alerts when things degrade — all in one real-time view.
Everything you need to stay on top of your builds
Built for engineering teams who ship fast and want to know exactly what's happening in their pipelines.
Real-Time Updates
Pipeline runs update live as they progress. No refreshing, no polling — just watch.
Every Provider, One View
GitHub Actions, GitLab CI, Bitbucket Pipelines, CircleCI, Azure DevOps, and Jenkins side by side in a single dashboard.
Team Workspaces
Shared workspaces with role-based access. Invite your team and monitor together.
Smart Filtering
Scope any view by provider, organization, or repository. Find exactly what you need.
Picture-in-Picture
Pop out a floating build dashboard that stays visible while you work in other tabs.
Pipeline Config Viewer
Inspect CI/CD configuration files directly from the dashboard without switching to your repo.
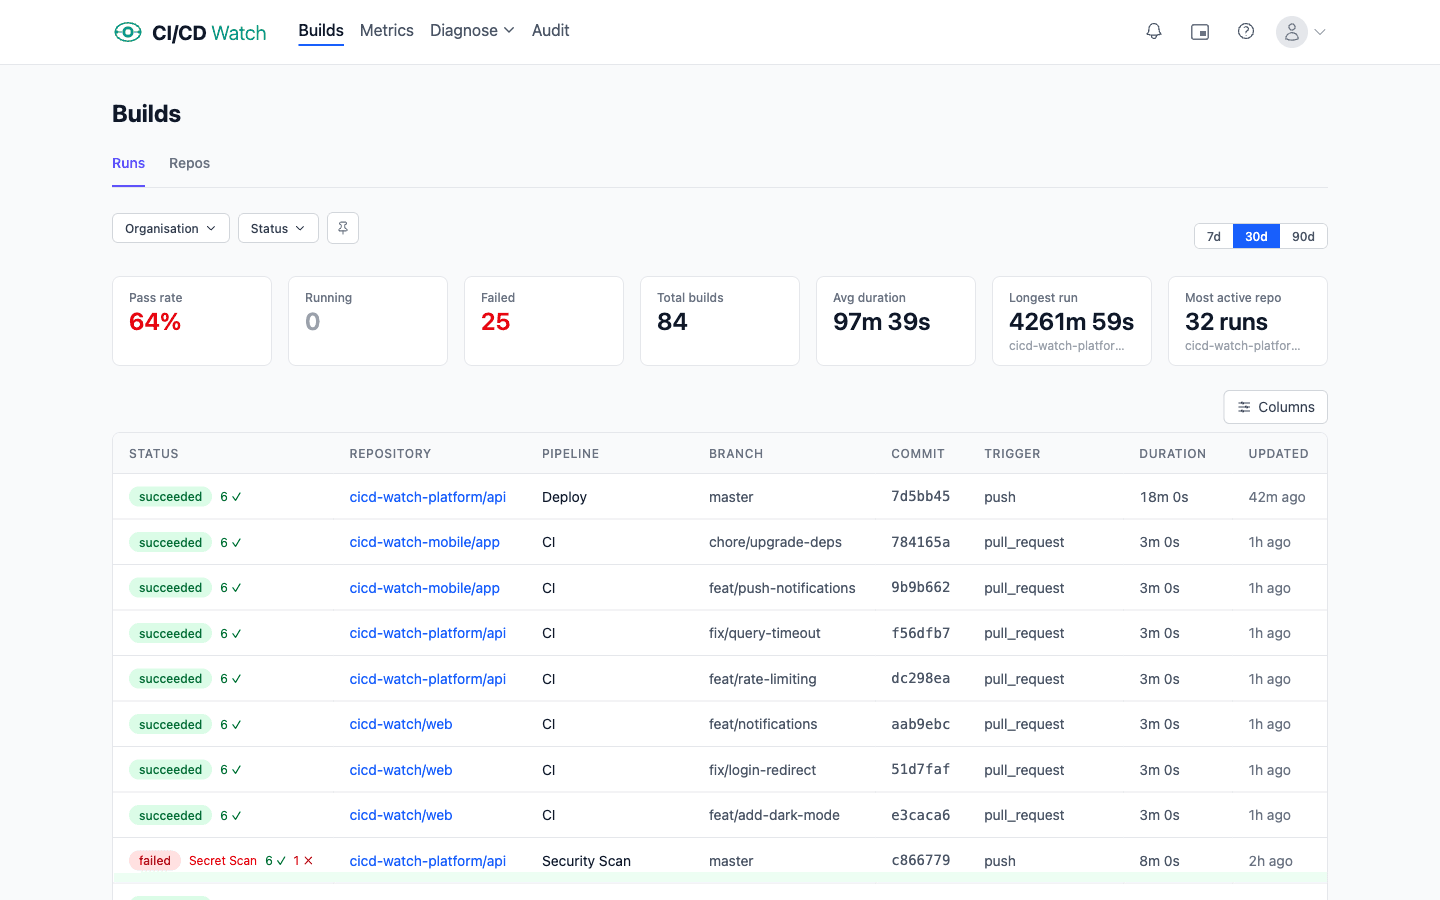
See it in action
From high-level metrics to pipeline-level insights, everything you need is one click away.
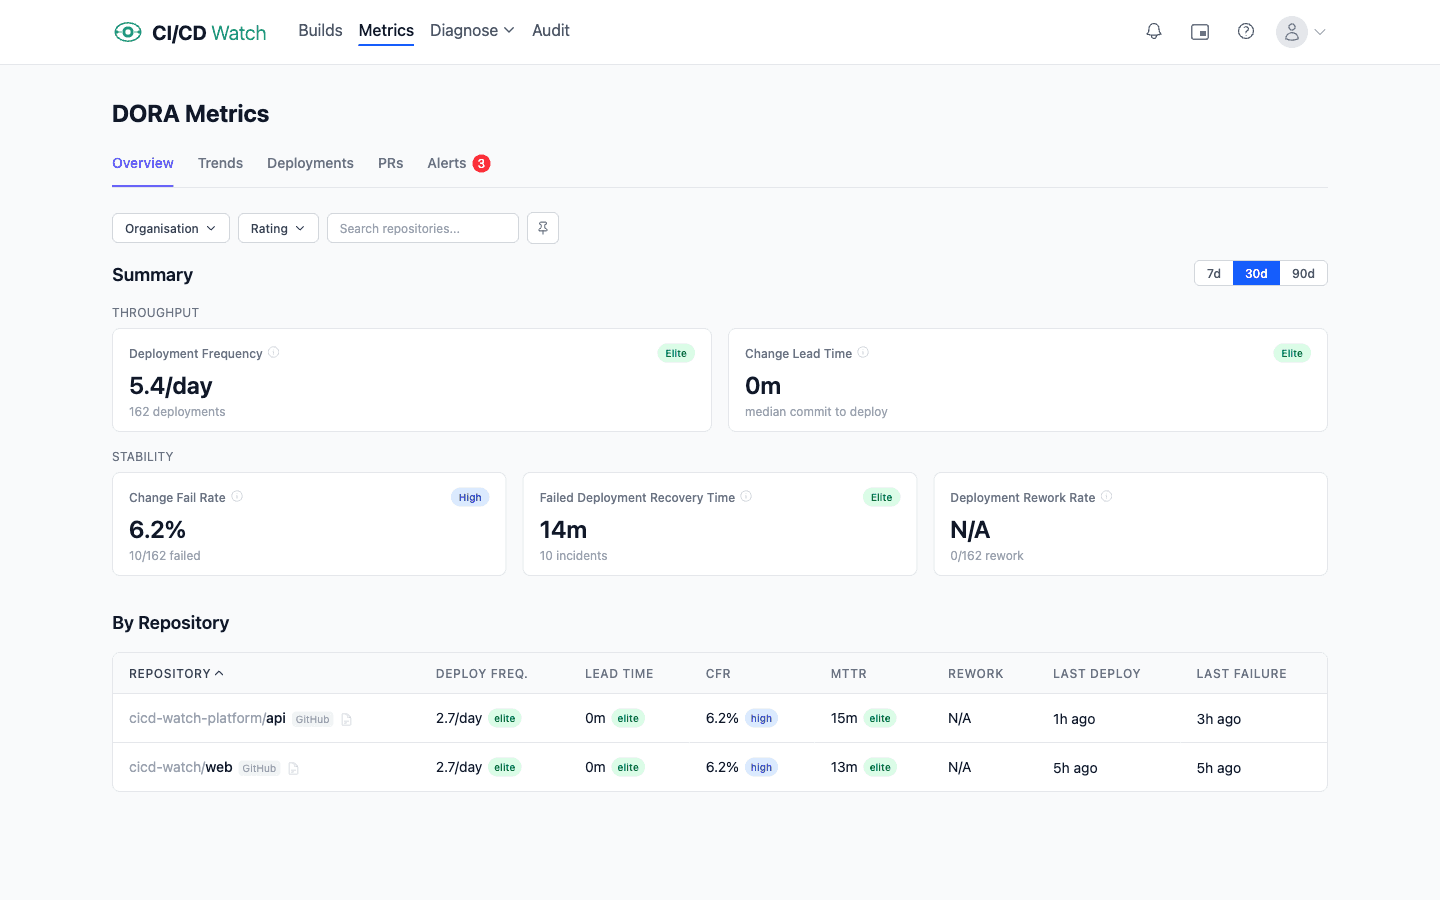
DORA Metrics
Track the five DORA metrics across all your repositories: Deployment Frequency, Change Lead Time, Change Fail Rate, Failed Deployment Recovery Time (MTTR), and Deployment Rework Rate. Visualize trends over time with daily and weekly charts across 7, 30, and 90-day windows.
Get proactive alerts when metrics degrade, see performance ratings at a glance, and drill down into per-repo breakdowns to pinpoint where your team can improve.
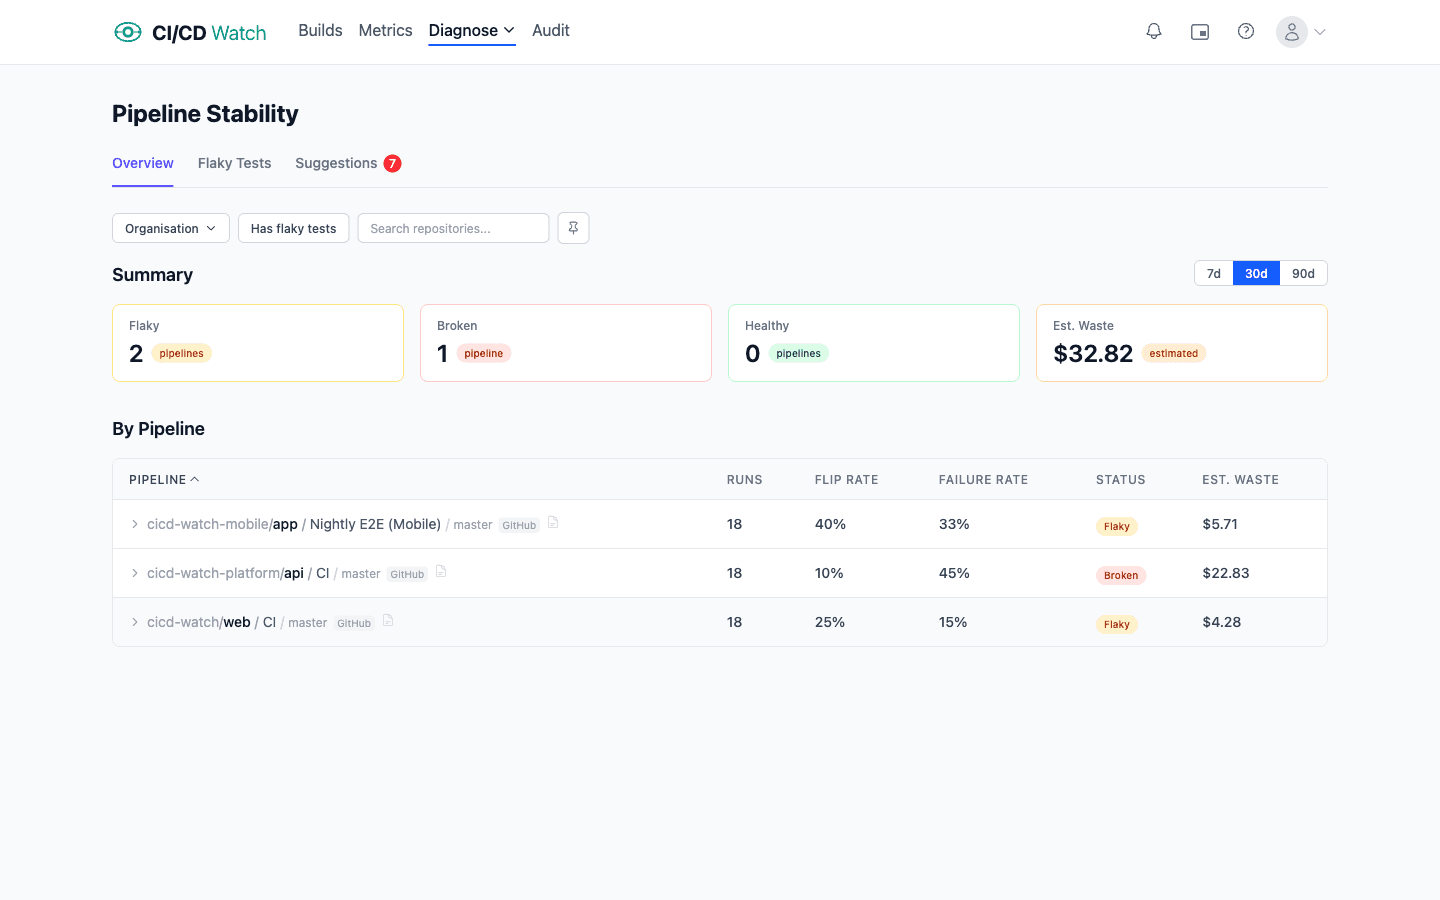
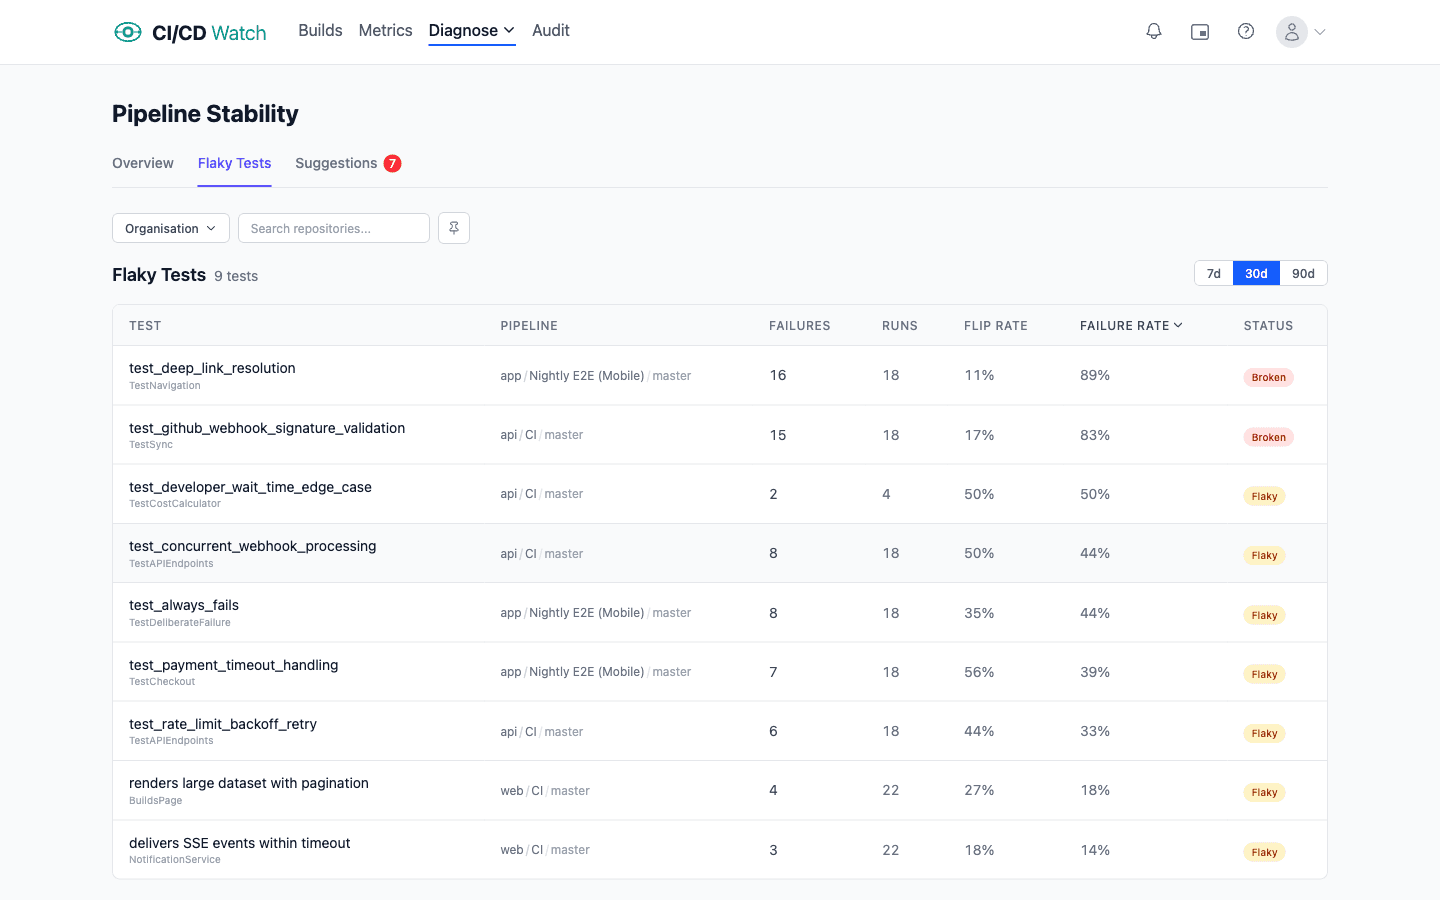
Pipeline Stability
Identify flaky and broken pipelines before they slow your team down. See flip rates, failure rates, and health status for every pipeline at a glance. Expand any pipeline to drill into per-job stability metrics.
Stop wasting time re-running unreliable builds. Analyze stability across 7, 30, or 90-day windows and know exactly which pipelines need attention.
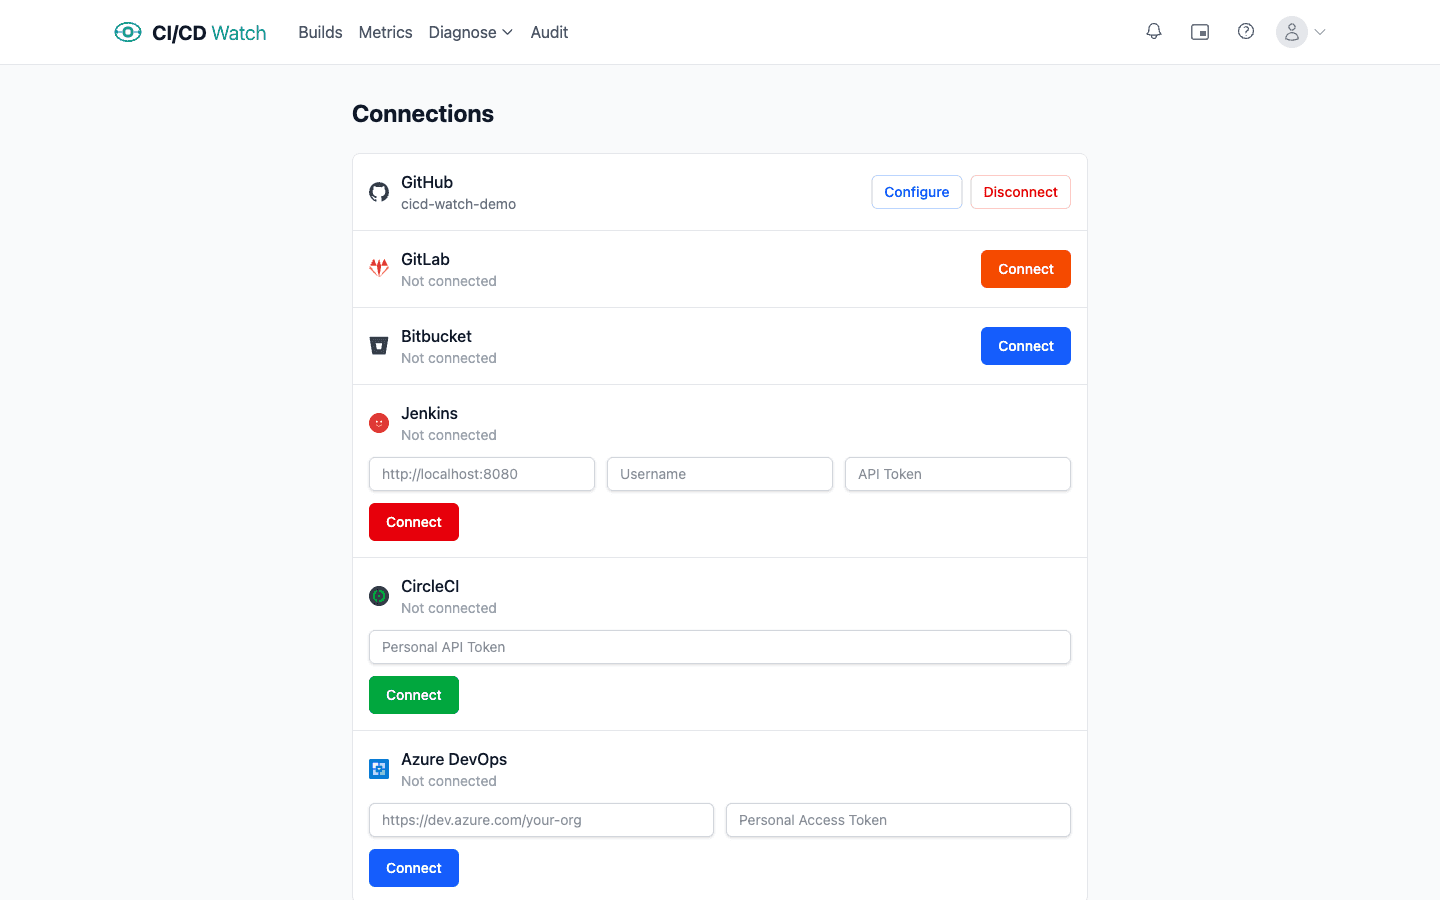
Connect in Seconds
Link your GitHub, GitLab, and Bitbucket accounts with a single click, or connect Jenkins, CircleCI, and Azure DevOps with an API token. Read-only access keeps your pipelines secure.
Manage all your connections from one place. Connect, configure, or disconnect any provider at any time.
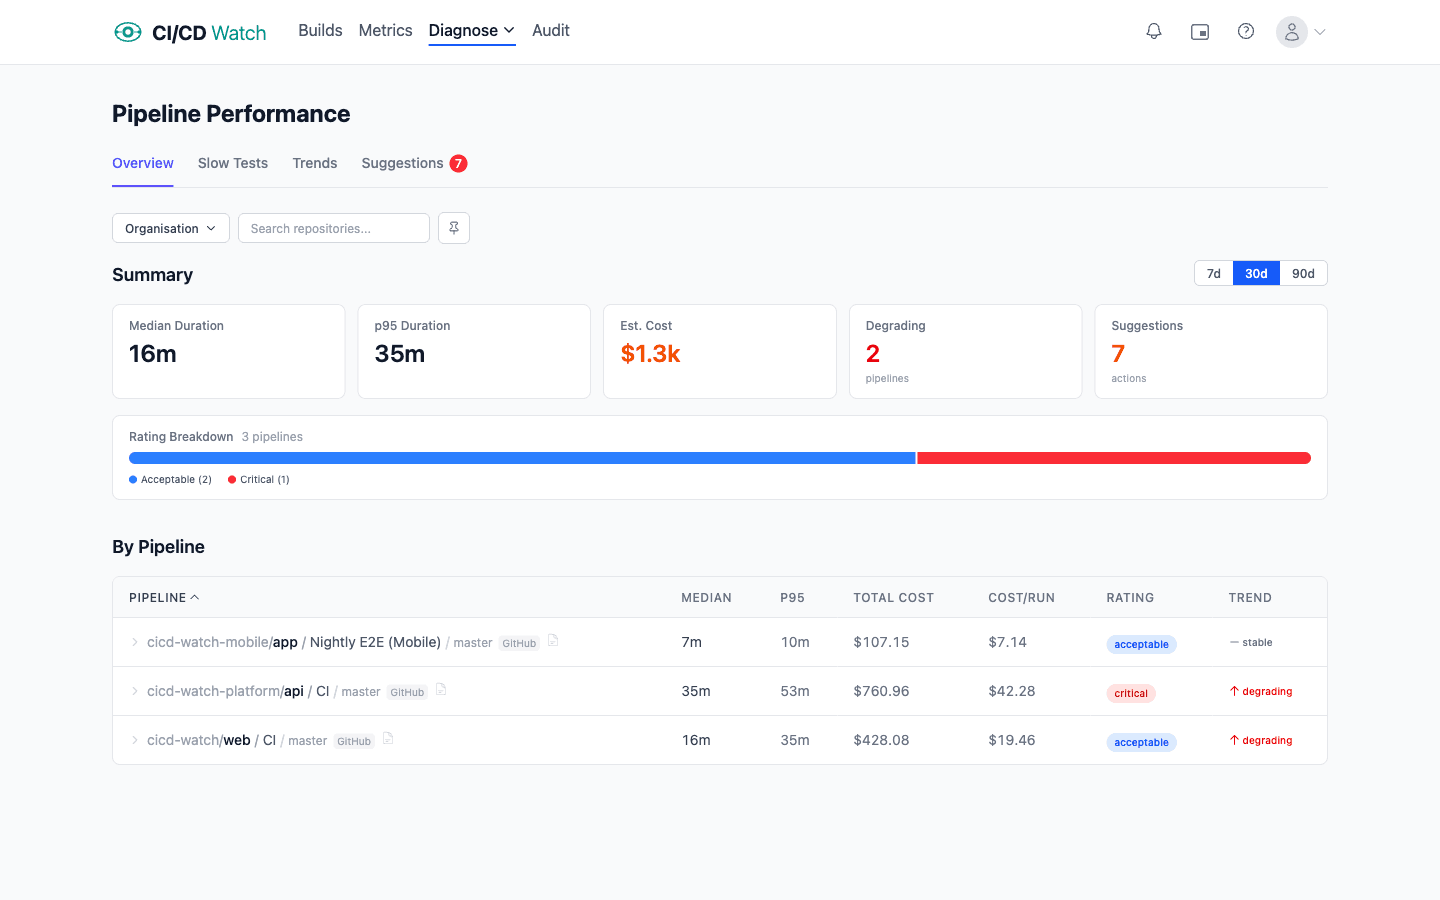
Pipeline Performance
Track how long your pipelines take and whether they're getting slower. Duration trend analysis with p95 tracking catches outliers before they become the norm. Each pipeline gets a performance rating — fast, acceptable, slow, or critical — so you know where to focus.
When a pipeline degrades, you'll see it. Actionable optimization suggestions — like parallelizing jobs or adding caching — help you fix the slowdown. Analyze across 7, 30, or 90-day windows and filter by provider, organization, or repository.
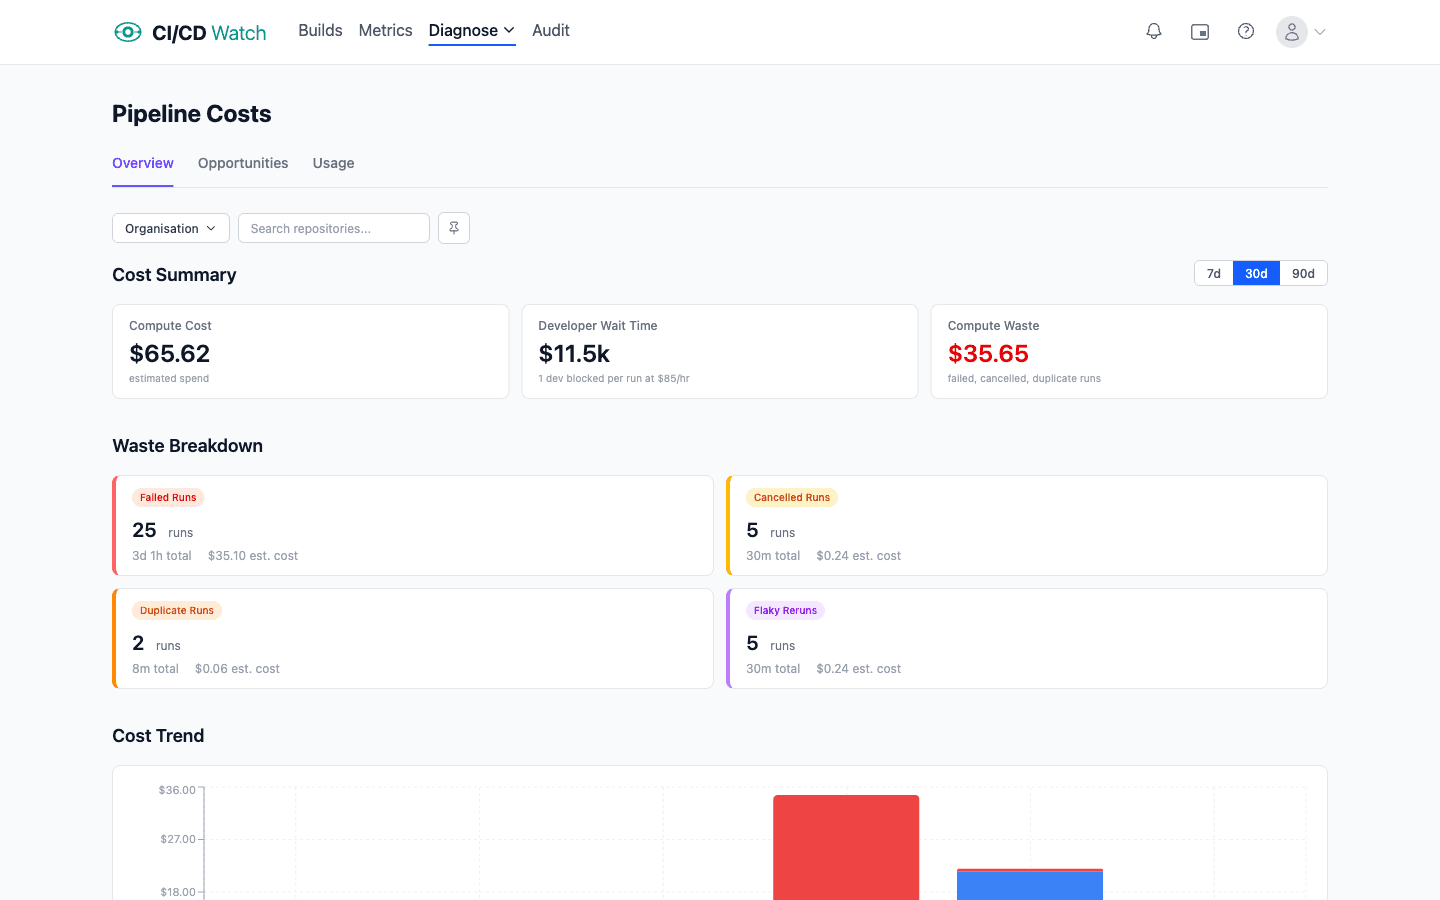
CI/CD Costs
See the true cost of your pipelines — not just compute, but developer wait time too. CI/CD Watch tracks both per-minute runner charges and the hourly cost of engineers blocked waiting for builds to finish. Configure custom rates to match your actual costs.
Waste is automatically categorized: failed runs, cancelled runs, duplicates, and flaky reruns. The cost opportunities page ranks pipelines by potential savings so you know exactly where to optimize first.
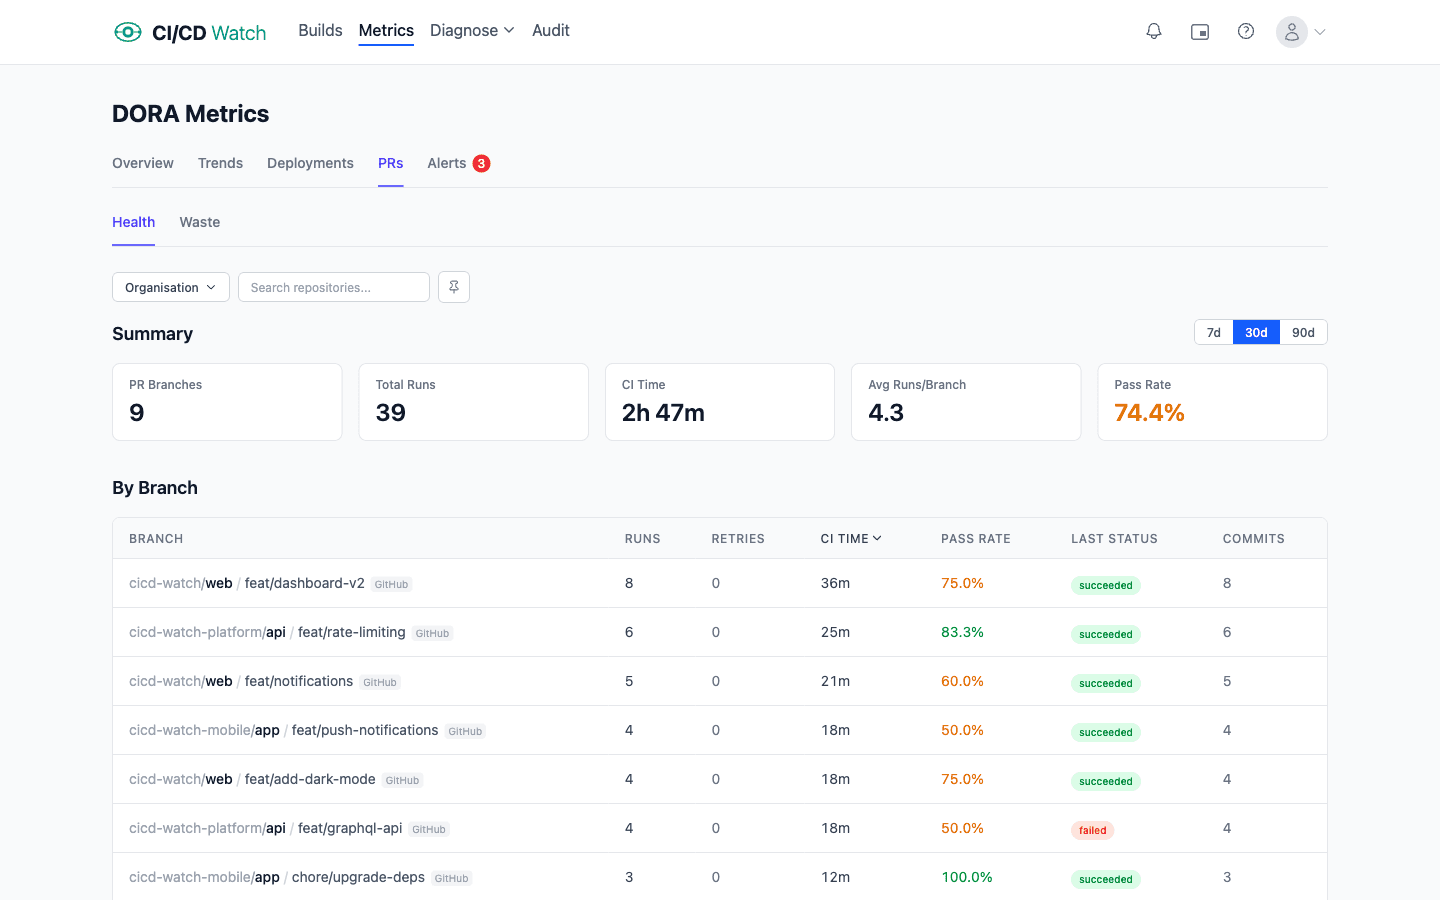
PR Health & Waste
See how CI impacts your pull request workflow. The PR health dashboard tracks success rates and CI pipeline reliability across all your repositories, giving you a clear view of how often PRs are blocked by CI failures.
The waste detection page surfaces developer wait time and wasted CI runs tied to pull requests — helping you identify inefficient pipelines that slow down code review and merging.
Test Results
Surface failing and flaky tests across all your pipelines automatically. Each test is classified as healthy, flaky, or broken based on its recent history. Drill into failure details with error messages, stack traces, and duration data.
See per-pipeline and per-repository breakdowns to find where test reliability is weakest. When test data is missing, CI/CD Watch hints at how to configure your CI to publish JUnit XML reports. Analyze trends across 7, 30, or 90-day windows.
Ready to see your pipelines in one place?
Connect your CI/CD provider and start monitoring in under a minute. Free to get started.