If your team uses more than one CI/CD provider, or even just one with dozens of repos, you know the pain. Pipeline status is scattered across tabs. Costs are invisible. Flaky tests waste hours. And when someone asks “how is the team shipping?”, the answer is a shrug.
We built CI/CD Watch, a CI/CD observability platform that monitors pipelines across GitHub Actions, GitLab CI, Bitbucket Pipelines, CircleCI, Azure DevOps, and Jenkins. One dashboard, real-time monitoring, and (on Team plan and above) DORA metrics, cost tracking, stability analysis, PR health, alerts, and Slack notifications.
Where this came from
CI/CD Watch started as an internal tool. We were working across a handful of product teams, each with their own mix of repositories and CI providers: GitHub Actions for most services, Jenkins for a few older systems, and a GitLab project a partner team had set up. Pipeline status lived in three different dashboards. Duration trends did not exist anywhere. When a release was going out and someone asked “which builds have gone green?”, the honest answer was “open three tabs and count.”
We built a prototype to consolidate the view, and when other teams started asking to use it, we turned it into a product. The premise has not changed: engineers should not have to stitch together their own observability for the system that ships their code.
The problem we are solving
CI/CD is the backbone of modern software delivery, but it is surprisingly hard to observe. Each provider has its own dashboard, its own data model, and its own blind spots. The result is a set of common problems that affect everyone from individual developers to engineering leadership:
- No unified view. If your organisation uses multiple providers, there is no single place to see all your pipeline runs.
- Invisible costs. CI compute costs are buried in billing pages. Developer wait time, which is the real cost, is not tracked at all.
- No delivery metrics. DORA metrics are the industry standard for measuring delivery performance, but most teams do not track them because collecting the data is too hard.
- Flaky tests go unfixed. Everyone knows which pipelines are unreliable, but nobody has the data to prioritise which ones to fix first.
What CI/CD Watch gives you
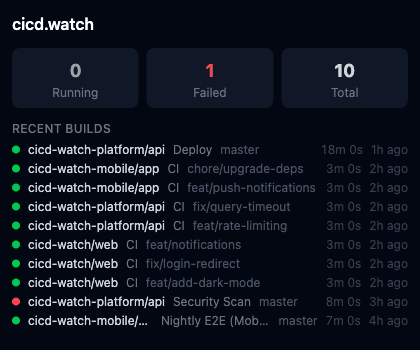
For developers: stay in flow
Stop switching tabs to check if your build passed. CI/CD Watch for developers gives you real-time build status, test failure drill-downs, and a Picture-in-Picture mode that floats a mini-dashboard over your editor. When a test fails, you see the test name, error message, and stack trace, not a wall of CI logs. The loop that used to be push, switch tab, find the repo, open Actions, scroll to your run, wait for green collapses to a glance at a corner of your screen.
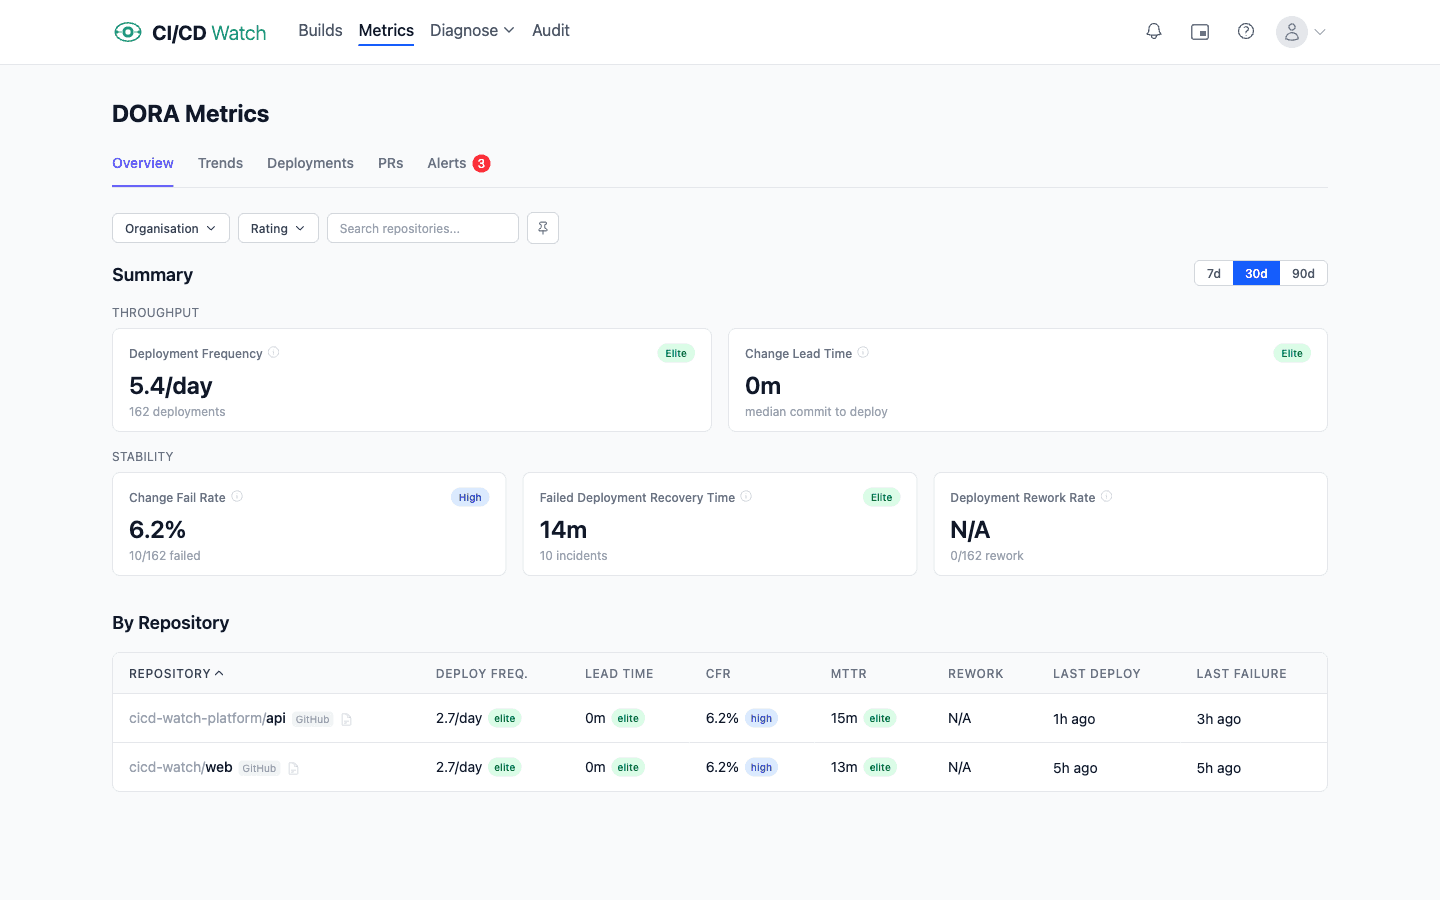
For engineering managers: real numbers, not vibes
When leadership asks how the team is performing, you need data. CI/CD Watch for engineering managers calculates the DORA metrics automatically: deployment frequency, change lead time, change fail rate, failed deployment recovery time (MTTR), and deployment rework rate (added to DORA in 2024). Trend charts show whether you are improving or degrading over 7, 30, or 90 days. Alerts fire when metrics regress so you catch problems early. Because the data is derived from pipeline runs, there is no cross-team negotiation about what counts as a deployment or how to clock lead time. Set the rules once in settings and every team reports on the same basis.
For tech leads: see the true cost of CI
CI costs are not just compute. Developer wait time is the hidden cost that nobody tracks. CI/CD Watch for tech leads breaks down both: compute charges and engineer-hours lost to slow or failing pipelines. Waste is categorised automatically: failed runs, cancelled runs, duplicate triggers, and flaky reruns. Each category shows estimated cost impact so you can quantify what to fix first. The first breakdown is usually a surprise. Cancelled runs from force-pushes often rival the flaky-rerun bill, and neither shows up anywhere on the provider's billing page.
For platform and DevOps teams: one pane of glass
Six providers, six dashboards, zero unified view. Until now. CI/CD Watch for platform teams consolidates everything into a single dashboard. Every pipeline is classified as healthy, flaky, or broken. Duration trend charts track p50 and p95 build times. The classification matters because it lets you triage: healthy pipelines are not demanding attention, broken ones are easy to find, and the flaky middle tier is where most of the wasted engineering time hides. Optimisation suggestions are generated from pipeline config analysis (parallelise jobs, add caching, split test suites), specific to each provider and framework.
Connect in under two minutes
CI/CD Watch connects to your CI/CD provider with a standard OAuth flow or API token. There is nothing to install in your pipelines: no agents, no plugins, no YAML changes. Your pipeline data starts flowing within seconds, and metrics, costs, and stability classifications appear automatically.
Supported providers:
- GitHub Actions
- GitLab CI
- Bitbucket Pipelines
- CircleCI
- Azure DevOps
- Jenkins
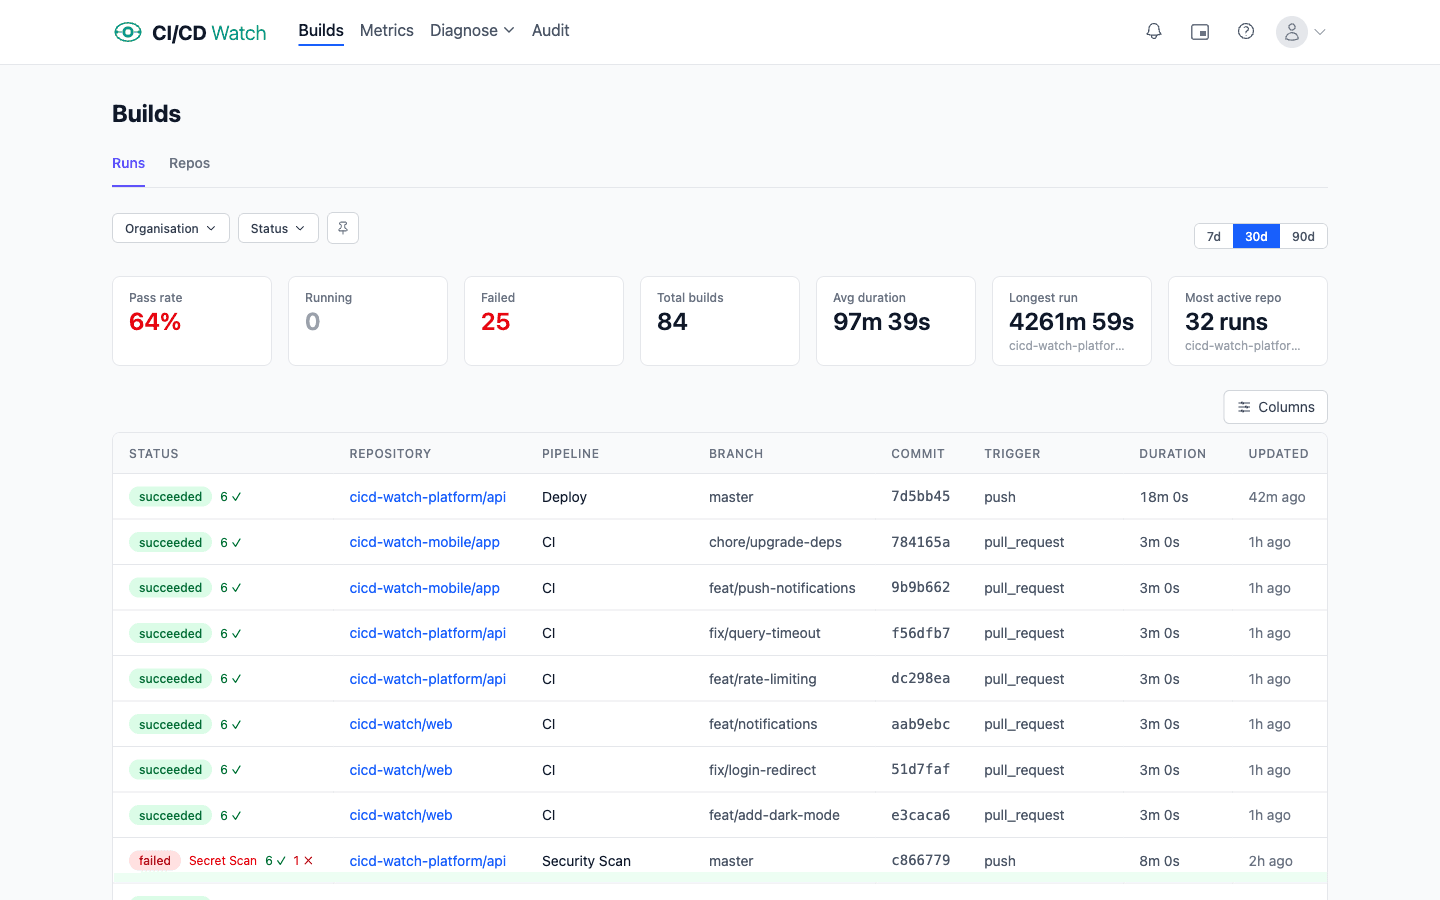
What you see on day one
Within the first minute of connecting a provider the dashboard shows every workflow run from the last seven days, not just the ones currently running or queued but the full history. Filter by repository, branch, status, or trigger to narrow the view.
Within the first hour, a few things usually surface. A repository that has not deployed in weeks despite green builds. A workflow whose p95 duration has drifted from eight minutes to fourteen over the last month. A flaky job that reruns itself once per PR on average, visible as a rerun pattern rather than “those annoying retries.” None of this is new information. It was all in the provider's API. But until you put it in one view, nobody was looking at it.
From there the first real question is usually “where is the time going?” That is where the Team plan features start paying for themselves: duration trends, waste categorisation, and DORA metrics turn the raw run list into a story about your delivery system.
Beyond the dashboard
The web dashboard is where most teams start, but CI/CD Watch also offers:
- Public API — query pipeline runs, DORA metrics, costs, and performance data programmatically
- MCP Server — ask Claude, Cursor, or Windsurf about your pipelines with CI/CD data grounded in reality
- CLI — monitor pipelines and check metrics from your terminal
- Slack — get pipeline failure alerts in team channels and personal DMs for your own builds (Team plan and above)
Get started
The Free tier covers pipeline monitoring for small teams. Connect a provider and you will see every workflow run in one view within minutes. Analytical insights (cost tracking, PR waste, DORA trends, test-level stability, alerts, and Slack) unlock on Team plan and above. No credit card required to start.
CI/CD Watch is built by 3CS Technologies Ltd. It started as an internal tool for tracking pipeline health across a mixed GitHub Actions and Jenkins estate. The same engine now powers the SaaS platform.