If you manage or work on a software team you have probably heard someone mention DORA metrics. They have become the standard way to measure how well a team delivers software. The five numbers are clean to define and hard to measure in practice. Most teams that adopt them stumble on the same set of definitional questions, and the metrics only earn their reputation as a diagnostic when the definitions hold steady over time.
This page is what we would tell a team starting from scratch: what DORA actually is, what each of the five metrics means, where the measurement traps live, why throughput and stability have to be read together, and what happens to the numbers when you turn them into performance targets.
More on DORA metrics
What is DORA?
DORA stands for DevOps Research and Assessment, a research programme led by Nicole Forsgren, Jez Humble, and Gene Kim. Their surveys of tens of thousands of engineering professionals identified a small set of metrics that reliably predict software delivery performance. Four metrics in the original research, with a fifth (deployment rework rate) added in the 2024 DORA Report as a complementary stability signal.
Their findings are published in the annual State of DevOps Report and the book Accelerate. The DORA team is now part of Google Cloud, and the metrics have become the de facto standard for engineering leadership to understand delivery health.
The five DORA metrics
Five metrics split along two dimensions. Two measure throughput (how fast you ship) and three measure stability (how reliably you ship). The stability side grew from two metrics to three in 2024 with the addition of deployment rework rate. Together they catch both speed and reliability without optimising either at the expense of the other.
1. Deployment frequency
How often your team successfully deploys to production. Elite teams deploy multiple times per day. Lower-performing teams may only deploy monthly or less. Higher frequency generally means smaller batch sizes, which reduces risk and accelerates feedback.
2. Lead time for changes
The time between a commit landing on your main branch and that code running in production. This captures everything from code review wait time to CI pipeline duration to deployment orchestration. Elite teams achieve lead times of under one hour. For a deeper treatment of the clock-start question, see lead time for changes.
3. Change fail rate
The percentage of deployments that cause a failure in production: a rollback, a hotfix, or a degraded service. This metric captures the quality of what you are shipping. Elite teams keep their change fail rate below 5%.
4. Failed deployment recovery time (MTTR)
When a deployment does cause a failure, how long does it take to restore service? This measures your team’s ability to detect, diagnose, and fix problems. Elite teams recover in under one hour. DORA now publishes this metric as failed deployment recovery time; the older name mean time to recovery (MTTR) is still in wide colloquial use and refers to the same thing.
5. Deployment rework rate
Added to the DORA framework in 2024, deployment rework rate is the ratio of deployments that are unplanned but happen as a result of an incident in production. Where change fail rate captures the percentage of deploys that need immediate intervention, rework rate captures the subsequent deploys generated to fix the problem. Together they give a fuller picture of how much deployment activity is reactive rather than planned feature work. A team with low change fail rate but high rework rate is recovering from each failure with lots of follow-up deploys, which is still a stability signal worth acting on.
How to measure each metric in practice
The definitions above are clean. Measuring them on a real CI/CD estate is where things get contested. A consistent measurement approach matters more than the absolute numbers. What you care about is whether the trend is moving in the right direction, and that only works if the rules do not shift underneath you.
What counts as a deployment?
The most contested question in practice. A tag push to main? A successful deploy-to-production workflow run? Promotion through a staging gate to a customer-facing environment? The right answer is whatever aligns with code actually reaching users, but that varies by team, environment, and release process. The important thing is picking a rule and applying it consistently, which is why deployment detection is best treated as configurable per-team via deployment rules rather than assuming every workflow run is a deployment.
When does lead time start?
DORA defines lead time as commit-to-production, but which commit? The first commit on a feature branch catches all the review and rebase time but is sensitive to how people work locally. The merge commit to main is cleaner but hides delays in review queues. Most teams settle on merge-to-main as the start point because it is unambiguous in Git history, and the review delays usually show up separately as PR-health metrics rather than being buried inside lead time.
What qualifies as a change failure?
A deployment that triggered a rollback is the clearest signal. A hotfix within 24 hours of the previous deploy is a strong one. An incident declared in an on-call system and linked to a release is another. Teams often drift over time, with incidents that would have counted last quarter quietly stopping this quarter, so the classification rules need to live somewhere visible and be applied uniformly across teams.
Where does MTTR start and stop?
The clock should start when customers are affected, not when someone in engineering notices. That means hooking into monitoring or status-page data, not just deployment logs. It should stop when service is genuinely restored. Rolling forward with a broken feature behind a disabled flag is not the same as fixing the underlying problem, even if the dashboard goes green.
Why these metrics matter together
DORA measures throughput and stability deliberately. Speed without stability is moving fast and breaking things; stability without throughput is rare-deploy risk concentrated into big-bang releases. The five metrics read together prevent either side from drifting unnoticed. Optimising one while the other slips backwards usually shows up as a regression in real team productivity, even when the headline number looks better.
To see why, imagine a team that pushes deployment frequency from weekly to daily. On the throughput side that looks like a fivefold win. But if change failure rate climbs from 5% to 20% over the same period, the actual result is more bugs reaching production, faster. Recovery work stacks up because incidents overlap. Developer time shifts from building features to rolling back and patching. The dashboard shows one metric going up and the team is arguably worse off than before the push for speed started.
The DORA research consistently shows that elite teams are not trading off speed for stability. They are better at both. They deploy more frequently and have lower failure rates. The practices that get them there (trunk-based development, test automation, small batch sizes, fast feedback loops) improve both axes at once. Speed and stability are not opposing forces; they are the same investment viewed from two angles.
A worked example: reading the metrics together
A team looks at their dashboard and sees deployment frequency once per day, change lead time two days, change fail rate 8%, failed deployment recovery time three hours, rework rate 18%. Each number on its own reads as merely OK. Read together they tell a coherent and uncomfortable story about how this team recovers from failure.
Daily deployments are healthy. A two-day lead time alongside daily deploys is a strong signal that PRs are queueing up somewhere before they reach main, either in code review or in CI. The team is shipping what has already merged, but new changes take two days to join that stream. 8% change fail rate is on the higher side of healthy, and a three-hour recovery time is slow for a team deploying daily. The 18% rework rate is the clinching detail: nearly one in five deploys is an unplanned follow-up to a production incident, meaning each failure is generating several catch-up releases. Together those three numbers suggest that when something breaks, recovery is neither fast nor clean. Probably manual rollbacks, probably no feature-flag kill switches on the riskier changes, and probably a pattern of patch-on-patch fixes rather than root-cause repair.
The next investment for this team is not pushing deployment frequency higher. It is reducing review-queue time to bring lead time down, and investing in deploy safety (canary rollouts, feature flags, automated rollback) to bring recovery time, change fail rate, and rework rate down together. A year later, with those improvements in place, pushing deployment frequency to multiple times per day becomes viable without making anything else worse. Read together, the five metrics point at the right next move. Read one at a time, they would have suggested optimising the one thing that was already working.
DORA performance levels
The DORA research places teams into four performance tiers (Elite, High, Medium, Low) based on how their metrics compare against the industry distribution. The thresholds below come from the State of DevOps benchmark tables and should be treated as guideposts, not targets in themselves.
| Metric | Elite | High | Medium | Low |
|---|---|---|---|---|
| Deployment frequency | Multiple per day | Weekly to monthly | Monthly to biannually | Less than biannually |
| Change lead time | < 1 hour | 1 day to 1 week | 1 week to 1 month | > 6 months |
| Change fail rate | 0 to 5% | 5 to 10% | 10 to 15% | > 15% |
| Failed deployment recovery time (MTTR) | < 1 hour | < 1 day | 1 day to 1 week | > 6 months |
| Deployment rework rate | Added to the framework in the 2024 DORA Report. DORA has not yet published performance-band thresholds for this metric; track the trend rather than a band. | |||
Source: DORA State of DevOps Report benchmarks. Any serious DORA tool should let you adjust these thresholds to match your own organisation; see the metrics configuration page for how this is handled here.
Goodhart’s Law and DORA
When a measure becomes a target, it ceases to be a good measure. DORA metrics are unusually susceptible to this: the numbers look clean and the definitions sound rigorous, which makes them feel safe in OKRs. They are not. The moment a team is graded on a DORA metric, the metric drifts away from the underlying reality it was meant to describe.
Each metric has a characteristic failure mode under target pressure:
- Deployment frequency. Teams ship empty deploys, split one feature across five releases, or start counting config pushes as deployments. The number goes up; what actually reaches customers does not change.
- Lead time for changes. Reviews get rubber-stamped, staging gets skipped, work gets pre-merged to private branches to stop the clock early. The number improves; actual review quality gets worse.
- Change fail rate. The definition of failure quietly narrows. Incidents get classified as not deploy-related. The production environment gets redefined so fewer deployments count. The number drops; production gets no more reliable.
- Failed deployment recovery time. Incidents get declared resolved before they actually are. Broken features get flag-disabled and called fixed. The clock stops; customers still see the problem.
- Deployment rework rate. Follow-up deploys stop being classified as rework. A fix is relabelled as a planned feature change; a hotfix becomes a routine release. The number improves; the stability it was meant to measure does not.
The fix is to use DORA metrics as a diagnostic thermometer, not a performance scorecard. Watch the direction of travel. Ask what the numbers imply about friction in the delivery system. Do not set threshold-based OKRs for individual teams, and do not grade engineering managers on their team’s score. The moment the numbers have consequences attached, the incentive to clean them up overtakes the incentive to improve the system underneath.
Treated as a diagnostic, the metrics are genuinely useful. Lead time creeping up for three weeks is a signal to look at CI duration, review queues, or deployment orchestration. Change failure rate climbing alongside deployment frequency is a signal that the team is pushing throughput past what their test coverage supports. In both cases the metric pointed at something real, and it only did so because nobody was being evaluated on it.
FAQ
- Who should track DORA metrics?
- Useful at every level. Engineering managers use them to understand team delivery health and communicate to leadership. Tech leads use them to identify bottlenecks (slow CI vs long reviews vs deployment queues). Platform and DevOps teams use them to measure the impact of infrastructure investments. Developers use them as a shared language for discussing delivery performance without finger-pointing.
- What is the difference between change fail rate and deployment rework rate?
- Change fail rate measures deploys that need immediate intervention (rollback, hotfix, incident response). Deployment rework rate measures the follow-up deploys generated to fix those failures. Together they give a fuller stability picture: a team with a low fail rate but a high rework rate is recovering from each failure with multiple catch-up releases, which is still a signal worth acting on.
- Can DORA metrics be used as individual performance targets?
- No. DORA metrics measure team and system performance, not individual productivity. Using them to evaluate individual developers creates perverse incentives: gaming deployments, avoiding risky changes, rushing fixes instead of doing proper root-cause analysis. Track them as a team-level diagnostic; never grade individuals on them.
- How do I start measuring DORA metrics?
- The biggest barrier is data collection. The metrics require correlating data across version control, CI pipelines, and deployment processes. Many teams build this themselves with scripts and dashboards, but maintaining that infrastructure becomes a project of its own. A platform that connects to your CI provider and derives the metrics automatically is usually the faster path.
- Do DORA metrics work for teams that deploy infrequently?
- They still apply, but the signal is coarser. Monthly deploys mean the deploy loop completes once a month, so every problem the loop would catch is detected a month late. Lead time and change fail rate are still measurable. The metrics tell you the loop is long; the work is shortening it, which typically means smaller batches and reducing manual gates.
- Can DORA metrics be gamed?
- Yes, and they will be the moment they're used as performance targets. Each metric has a characteristic failure mode: deployment frequency gets gamed with empty deploys, lead time with rubber-stamp reviews, change fail rate with definitional drift, recovery time with premature 'resolved' declarations. The fix is to use them as a diagnostic thermometer, not a scorecard. See the Goodhart's Law section above.
- What's the relationship between DORA metrics and CI/CD monitoring?
- DORA measures the deploy loop specifically. CI/CD monitoring is broader: it measures every feedback loop in the delivery system (commit, review, deploy, recover). DORA is a subset of CI/CD monitoring, focused on the highest-level outcomes (how often, how fast, how reliably the deploy loop produces value). Healthy DORA almost always sits on healthy CI/CD signals underneath.
Start tracking DORA metrics
The biggest barrier to DORA metric adoption is data collection. The metrics require correlating data across your version control system, CI pipelines, and deployment processes. Many teams try to build this themselves with scripts and dashboards, but maintaining that infrastructure becomes a project of its own.
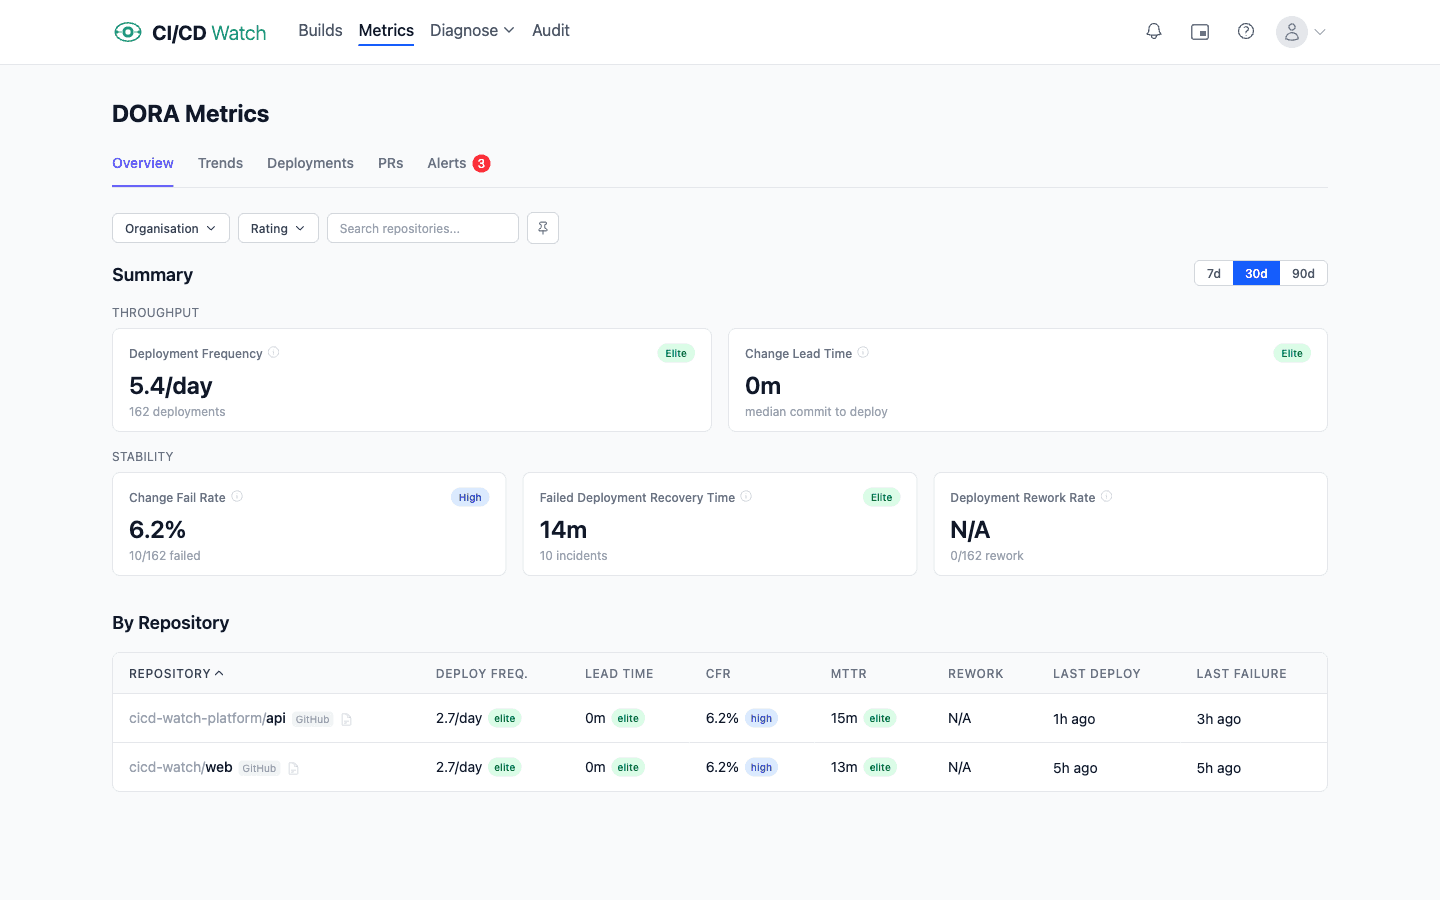
CI/CD Watch, a CI/CD observability platform that monitors pipelines across GitHub Actions, GitLab CI, Bitbucket Pipelines, CircleCI, Azure DevOps, and Jenkins, calculates the DORA metrics automatically from your existing pipeline data. Connect a provider and your metrics appear within minutes. No manual tagging, no custom instrumentation. How each metric is calculated is documented in our DORA metrics documentation.