DORA Metrics
The five DORA metrics measure software delivery performance. For the concept explainer, see our guide to DORA metrics. This page covers how CI/CD Watch calculates them from your pipeline data.
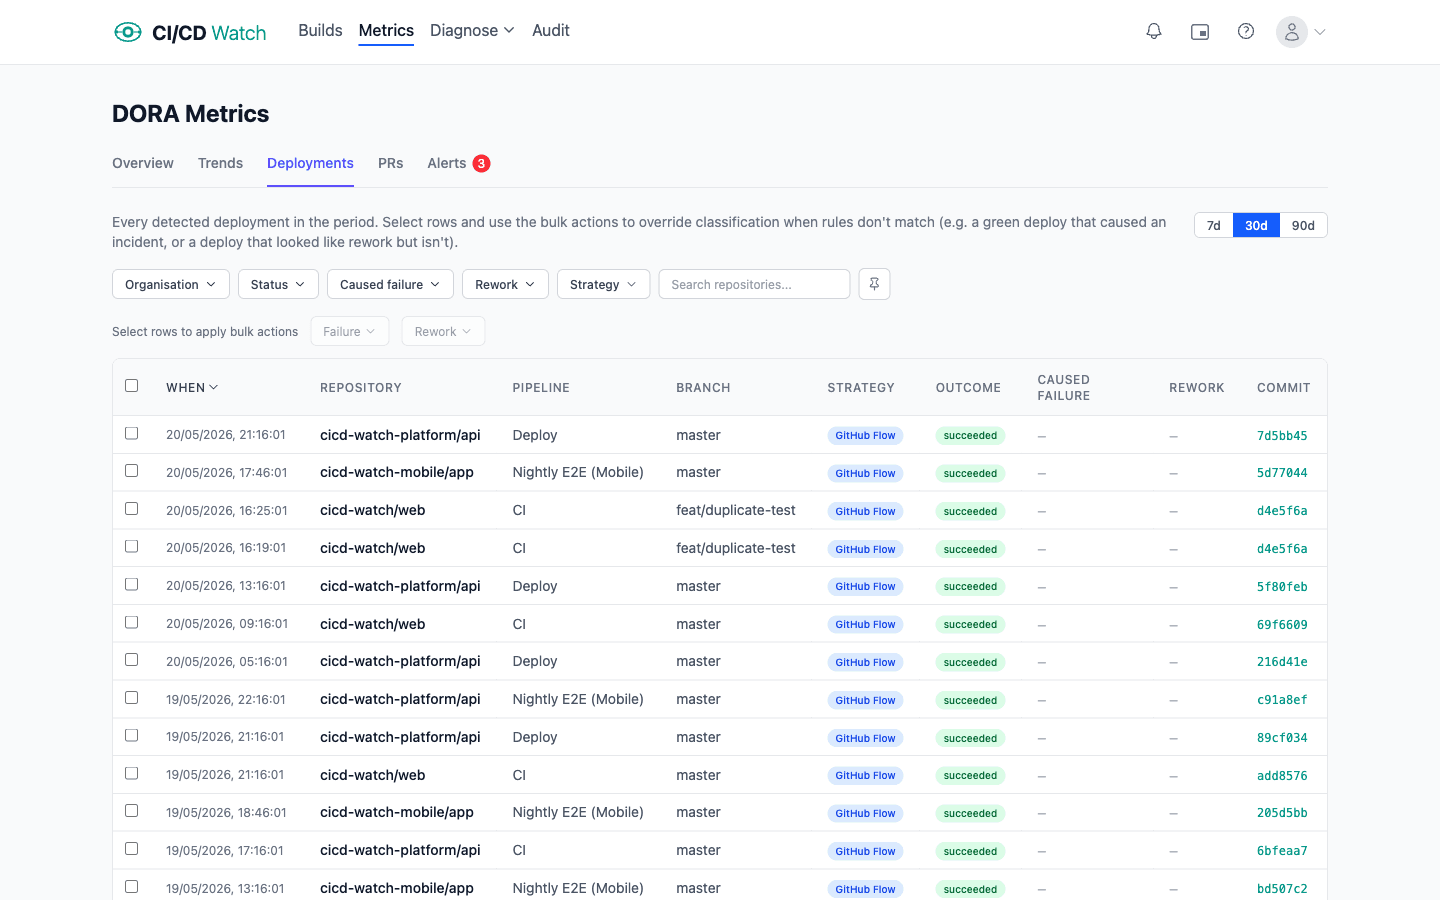
No manual tagging required, connect a provider and select which branches represent deployments.
Rating Thresholds
Each metric is rated on a four-level scale based on the thresholds established by the DORA research program. These defaults can be customised in Settings → Rating Thresholds.
| Metric | Elite | High | Medium | Low |
|---|---|---|---|---|
| Deployment Frequency | ≥ 1/day | ≥ 1/week | ≥ 1/month | < 1/month |
| Lead Time | ≤ 1 hour | ≤ 1 day | ≤ 1 week | > 1 week |
| Change Failure Rate | ≤ 5% | ≤ 10% | ≤ 15% | > 15% |
| MTTR | ≤ 1 hour | ≤ 1 day | ≤ 1 week | > 1 week |
Deployment Frequency
What it measures: How often your team ships code to production. Higher deployment frequency is associated with smaller, safer changes and faster feedback loops.
How CI/CD Watch calculates it: Counts the number of successful pipeline runs on your configured deployment branch (default: main or master) within the selected time window, then divides by the number of days in that period to produce a deployments-per-day rate.
Data source: Successful pipeline runs on deployment branches, filtered by the time window you select (7, 30, or 90 days).
Change Lead Time
What it measures: The time it takes for a commit to reach production. This captures your entire pipeline duration plus any queuing or waiting time.
How CI/CD Watch calculates it: For each deployment (successful pipeline run on the deployment branch), calculates the time between the commit timestamp and the run completion time. Reports the median across all deployments in the period. Deployments without a commit timestamp are excluded from the calculation.
Data source: Commit timestamps and pipeline run completion times on deployment branches. Your CI provider supplies the commit timestamp; CI/CD Watch records when the run finishes.
Change Failure Rate
What it measures: The percentage of deployments that result in a failure. A lower rate means your changes are more reliable.
How CI/CD Watch calculates it: Takes all completed pipeline runs (succeeded or failed) on branches that have deployments. The rate is the number of failed runs divided by the total completed runs. Runs with other statuses (running, cancelled, etc.) are excluded.
Data source: All completed pipeline runs on deployment branches within the selected time window.
Failed Deployment Recovery Time (MTTR)
What it measures: How quickly your team recovers from failures. Shorter recovery times mean less impact on users and faster incident resolution.
How CI/CD Watch calculates it:Groups pipeline runs by repository and branch, then walks through runs chronologically looking for failure-to-success sequences. For each sequence, recovery time is measured from the first failure's start time to the next success's completion time. Reports the median recovery time across all such sequences.
Data source: All pipeline run statuses and timestamps on deployment branches, ordered chronologically per repository and branch.
Deployment Rework Rate
What it measures: The proportion of deployments that required a follow-up deployment to fix or roll back a problem the original deployment introduced. Added by DORA in 2024 as the fifth metric, alongside the four classic indicators. A high rework rate indicates batches that are too large, too coupled, or insufficiently tested before reaching the deployment branch.
How CI/CD Watch calculates it: Walks deployment-classified pipeline runs chronologically. A deployment is counted as rework when a subsequent deployment on the same repository and branch lands within the rework window AND is preceded by a failure or revert signal on the prior deployment. The metric is reported as the percentage of deployments in the window that triggered rework.
Data source: Deployment-classified pipeline runs and their status transitions, ordered chronologically per repository and branch.
Deployment Rework Rate complements Change Failure Rate. CFR captures the proportion of deployments that fail outright; rework rate captures the proportion that look successful at the time but need a follow-up fix later. Read them together rather than choosing one over the other.
Metric Trends
The trends page (under Metrics → Trends) shows charts for all five DORA metrics over time. For 7-day and 30-day windows, data points are shown daily. For 90-day windows, data is aggregated weekly to keep charts readable.
Use trends to track improvement over time, spot regressions early, and validate that process changes are having the intended effect on your delivery performance.
Deployment Detection
CI/CD Watch determines what counts as a "deployment" based on branch matching. By default, pipeline runs on main or master are treated as deployments.
If your team uses a different branch for production deployments (e.g. production or release/*), you can configure the deployment branch in your connection settings. Only pipeline runs matching the configured deployment branch are used for DORA metric calculations. You can also fine-tune how lead time and MTTR are measured in Settings → Metrics Configuration.
Deployment Classification
Once a pipeline run is detected as a deployment, CI/CD Watch runs a second pass to classify whether it is rework (an unplanned follow-up to a production incident). This feeds the Deployment Rework Rate metric and, in a later release, will also drive Change Fail Rate and MTTR.
Classification has two sources, in priority order:
- Manual override, a user marks a deploy as rework from the deployments list. Always wins.
- Classification rules, configurable patterns matched against each deploy's branch name, commit message, PR labels, and any incident references in the commit or PR body. Rules are additive (any match classifies the deploy). CI/CD Watch ships with defaults covering
hotfix/*andfix/*branches, Conventional Commitsfix:/hotfix:prefixes, common PR labels, and incident-identifier patterns likeINC-1234.
Configure rules in Settings → Metrics under “Deployment Classification”.
Related
- Deployment Detection , how CI/CD Watch identifies which pipeline runs are deployments
- Performance Ratings , pipeline duration ratings and trend analysis
- Pipeline Stability , how pipeline reliability affects change failure rate
- PR Health , how PR cycle time relates to change lead time