Metrics Configuration
Fine-tune how DORA metrics are calculated for your organisation.
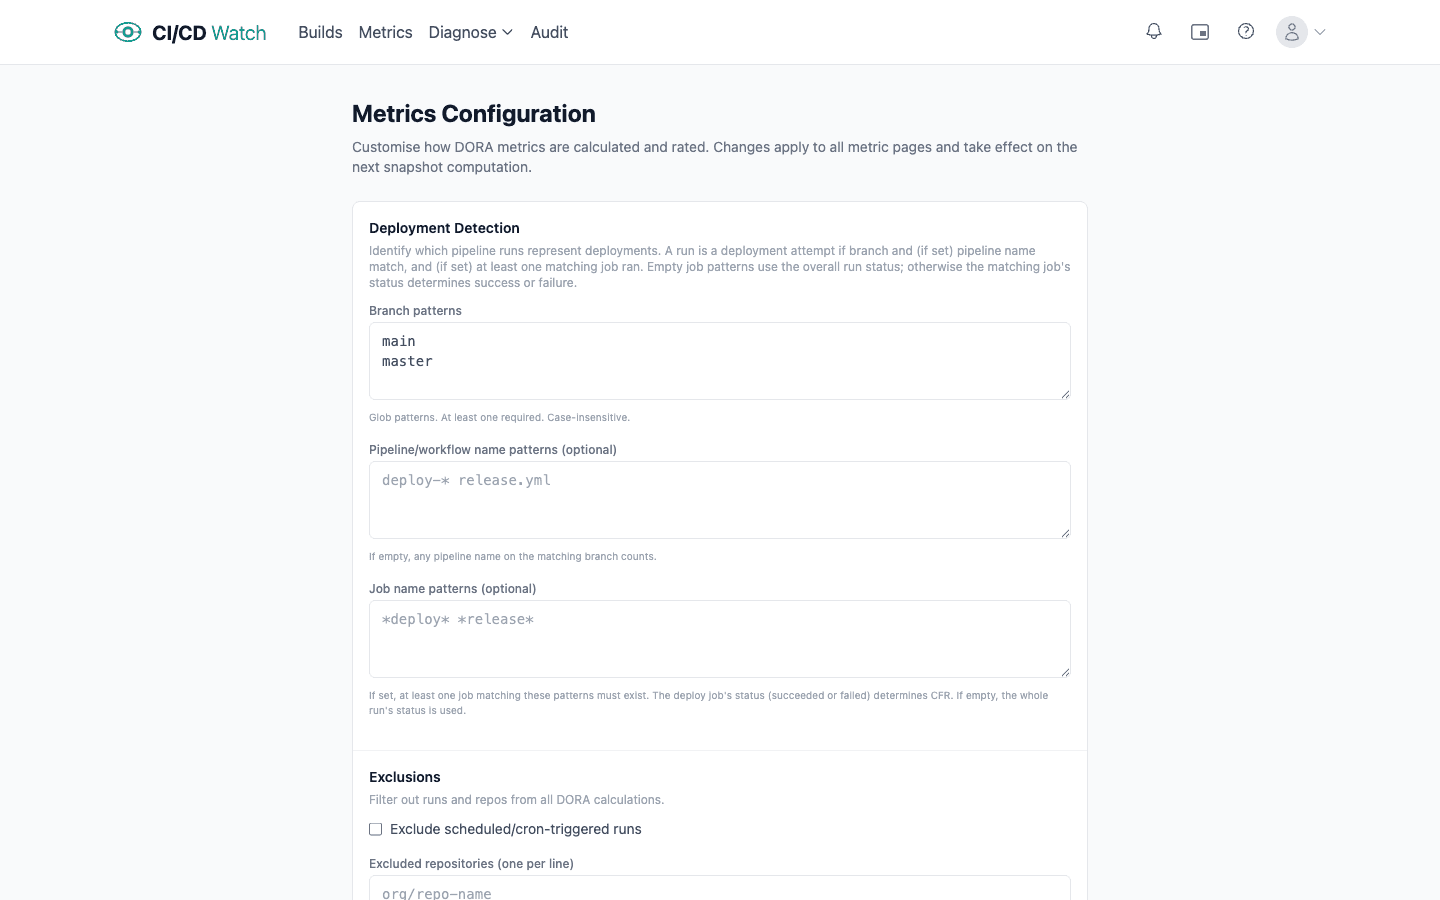
Exclusions
Filter out noise from your DORA calculations:
- Scheduled runs
- Toggle a checkbox to exclude all scheduled/cron-triggered pipeline runs from metric calculations. These runs still appear individually but don't count toward aggregate numbers.
- Excluded repositories
- List repositories (one per line, e.g.
org/repo-name) to exclude from aggregate DORA metrics. Useful for test repos, forks, or infrastructure-only repos that would skew your numbers.
Lead Time Measurement
Choose what “lead time” means for your team:
- Commit timestamp (default)
- Measures from when the code was written to when the deployment completes. Captures the full cycle including code review and merge queues.
- Pipeline trigger
- Measures only CI/CD execution time, from when the pipeline starts to when it finishes. Useful if you want to isolate pipeline performance from process overhead.
MTTR Settings
Control how Failed Deployment Recovery Time (MTTR) is calculated:
- Recovery signal
- Next successful run (same branch), any green CI run counts as recovery. Next successful deployment, only counts when code reaches production (stricter, better reflects user impact).
- Incident grouping
- Each failure, every failed run starts a new incident timer. Gives a granular view. Consecutive failures, a burst of failures counts as a single incident. Avoids inflating incident counts when the same problem causes multiple red runs.
Rating Thresholds
Customise the elite / high / medium / low bands for each DORA metric. The defaults follow the DORA research thresholds, but you can adjust them to match your team's context. Each metric has three editable boundaries:
| Metric | Unit | Direction |
|---|---|---|
| Deployment Frequency | deploys per day / week / month | Elite if ≥ value |
| Lead Time | hours | Elite if ≤ value |
| Change Failure Rate | percentage | Elite if ≤ value |
| MTTR | hours | Elite if ≤ value |
Anything below the medium threshold is rated Low. Adjust these values to set realistic targets for your team and track progress toward them.