A developer is mid-task in Claude Code. The agent has drafted a fix for a bug in the auth module. It runs the test suite. Three tests fail. The agent reads the output, suggests a tweak, retries. Two pass. The third keeps failing. The agent tries another tweak. Now four tests fail. The agent narrates its confusion in the chat and asks if the developer can rerun the suite manually.
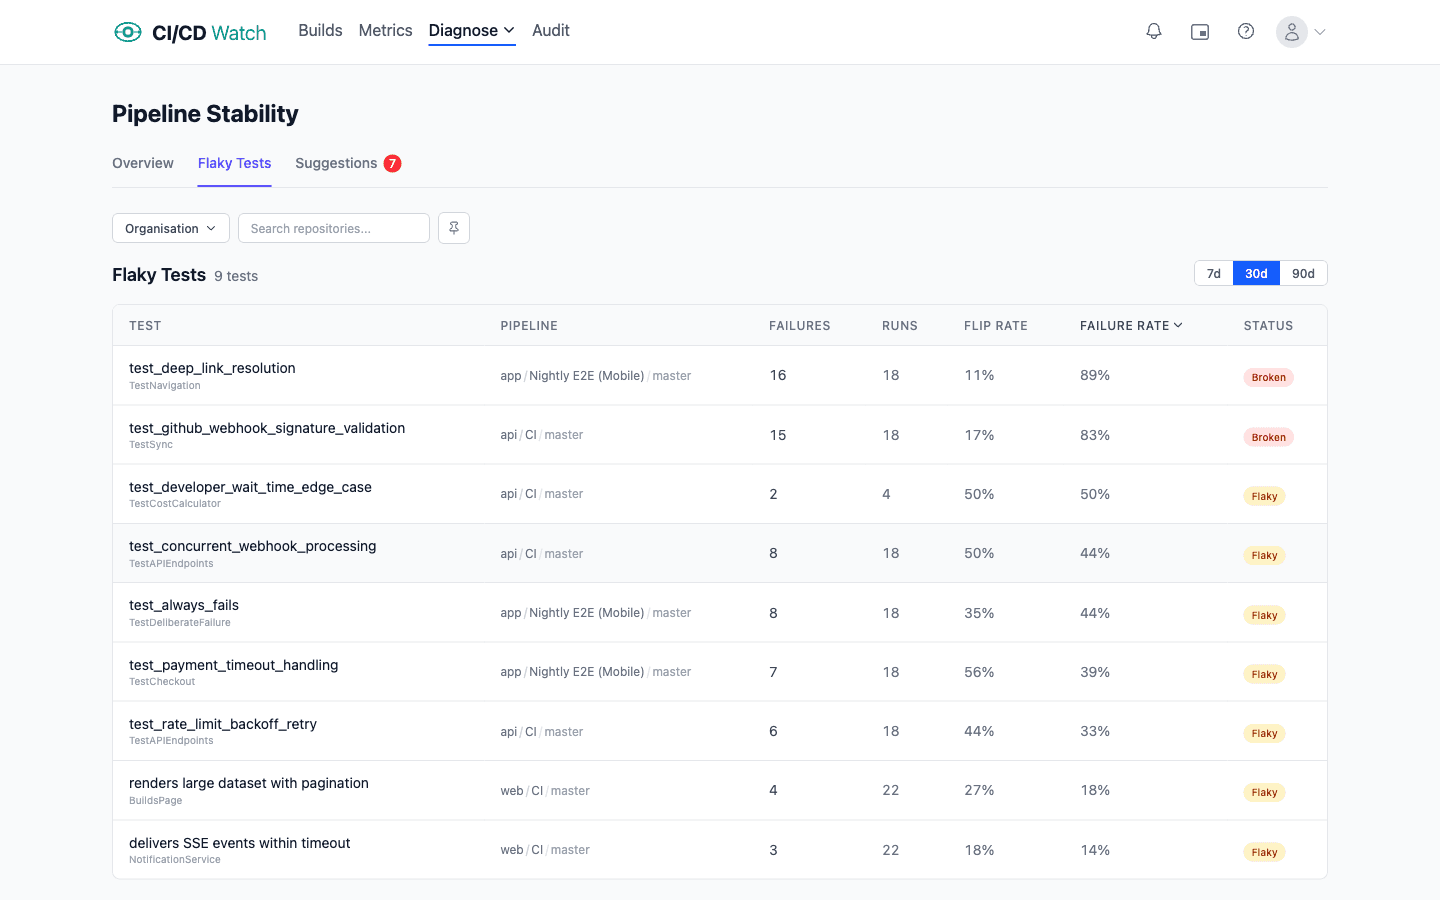
The third test is flaky. It has been flaky for three weeks. It is on the team’s quarantine list but nobody got around to skipping it. None of that context exists in the assistant’s prompt. The assistant is working blind on a problem the team already classified and shelved.
More on AI-assisted development
Your AI assistant is flying blind without CI/CD context
AI coding assistants see your code and whatever you paste into the chat. They do not see your pipeline history, DORA numbers, audit findings, cost waste, or which tests are quarantined for being flaky. They infer everything about delivery health from the small window of context you give them.
That gap matters more as assistants take more autonomous actions. A pair-programming assistant guessing about a flake costs you minutes of wasted chat. An agent triggering its own rerun on a flake costs you a CI minute and a compounded false signal. An agent suggesting a refactor based on what it assumes about your pipeline practices costs you a review cycle when the suggestion turns out to contradict the team’s actual rules.
The fix is structural: give the assistant a way to read the same data the platform team reads. Not by training, not by pasting screenshots, and not by hoping the assistant guesses correctly. By exposing the data through a typed interface the assistant can call. The MCP (Model Context Protocol) is the standard for that today. CI/CD Watch implements it; for the buyer-facing setup walkthrough see CI/CD for AI-assisted development and the underlying MCP server reference.
What an assistant needs to see
Once connected, an AI assistant gains access to eight tools that mirror the data surfaces in the web app: recent pipeline runs, connected providers, DORA metrics, cost analysis, performance analysis, audit runs, individual audit run detail, and audit findings. Every tool is read-only by design. The assistant can query everything the platform team queries; it cannot trigger reruns, change connections, or alter settings.
The shape of the data matters. The MCP server does not return raw provider payloads; it returns the same normalised data the web app renders, across GitHub Actions, GitLab CI, Bitbucket Pipelines, CircleCI, Azure DevOps, and Jenkins. So an assistant asking “what is the flip rate on login-flow.test.ts” gets the same answer whether the repo runs on GitHub or Jenkins. Provider differences sit behind the protocol, not in the assistant’s prompt.
The classifications are surfaced too. Healthy, flaky, and broken come back as fields on workflows and tests. The audit pillars (tests, lint, supply chain, workflow efficiency, flaky-test handling, process hygiene, cost waste) come back as structured findings with severity, evidence, and a remediation pointer. The assistant gets the conclusions, not just the raw signal, which means it spends fewer tokens deriving them itself and more tokens acting on them.
What changes in practice once it can
Three patterns show up once an assistant has CI/CD context. The first is grounded triage. The assistant answers “why did this test fail” with a query against the flaky-test data rather than a guess from the error output. If the test is on the quarantine list it says so; if the flip rate is high it says so; if the failure is a genuine regression it says that too. Every answer is checkable against the platform’s own classification.
The second is DORA-aware suggestions. An assistant proposing a workflow change can query get-dora-metricsfirst and reason about whether the change would help or hurt the team’s lead time. A suggestion to add more matrix dimensions looks different when the assistant can see that the workflow’s p95 duration is already at the slow tier; a suggestion to merge before a flake clears looks different when the assistant can see the change failure rate trend.
The third is audit-grounded refactors. The stability classification and the audit findings give an assistant structured opinion about what the platform team wants. An assistant that knows the supply-chain pillar has flagged unpinned actions can suggest pinning them; an assistant that knows the workflow-efficiency pillar has flagged a missing timeout can add one. The platform team effectively writes the rules once and every MCP-connected assistant follows them.
The amplification thesis
The 2025 DORA Report on AI-Assisted Software Development finds that AI tools amplify a team’s existing CI/CD practices rather than fixing them. Teams with strong trunk-based development, fast tests, and healthy stability get more value because the assistant’s feedback loop is fast and reliable. Teams with long pipelines, flaky tests, and rerun-as-policy culture get less.
The corollary follows: the observability signals that told you whether your CI/CD practices were healthy last year matter more this year. DORA, stability, cost, and audit are not separate concerns from AI-assisted development; they are the inputs that determine whether AI assistance pays off.
This is why the CI/CD Watch product surface and the AI-integration surface are the same product. The same signals the platform team uses to keep delivery healthy are the signals an AI assistant needs to make grounded suggestions. Closing the assistant’s context gap is closing the platform team’s feedback loop, from a new direction.
Anti-pattern: AI throughput as the metric
The strongest anti-pattern around AI-assisted dev today is using AI throughput as a productivity proxy. Lines accepted, suggestions merged, time saved per prompt. These numbers are easy to extract from assistant telemetry, hard to interpret, and actively misleading when read as productivity. A suggestion accepted in the IDE is not a deployment that landed safely in production.
The DORA metrics measure the right thing for the AI era for the same reason they measured the right thing before. Deployment frequency, lead time for changes, change failure rate, mean time to recovery, and deployment rework rate care about whether code reaches production safely, not about who or what wrote it. If AI assistance is helping, those numbers move in the right direction. If it is not, the throughput metrics will say it is anyway. Lead with the outcome metrics, not the activity metrics.
Read together
The signals an assistant can read
The MCP server exposes eight read-only signals that together describe a team’s delivery state. Five are analytical (runs, DORA metrics, costs, performance, connections) and three are audit-focused (recent audit runs, single-run detail, findings). Read-only by design, so an assistant can query every surface the platform team queries but cannot trigger reruns, change settings, or alter connections.
The full tool signatures, input parameters, and return shapes live in the MCP server reference.
Where CI/CD Watch fits
CI/CD Watch is a CI/CD observability platform that monitors pipelines across GitHub Actions, GitLab CI, Bitbucket Pipelines, CircleCI, Azure DevOps, and Jenkins. The web app is the team-facing surface; the MCP server and CLI are the assistant-facing surfaces. All three read normalised data and apply the same classifications.
The MCP integration works on the Free tier so you can wire it up end to end before paying for anything. The data each tool returns is gated by the same plan tiers as the rest of CI/CD Watch; see pricing for the per-tier detail.
We built the MCP server early because we treat AI-assisted development as a first-class consumer of CI/CD signals, not a downstream marketing angle. If you are integrating an assistant against a CI/CD tool that does not have an MCP server, the alternative is parsing the provider’s native API yourself for every question the assistant asks. The protocol is the reason this works at all.
FAQ
Common questions
- What is MCP and why does it matter for CI/CD?
- The Model Context Protocol is an open standard that lets AI assistants connect to external data sources through a typed tool interface. For CI/CD it matters because the alternative is pasting pipeline logs or DORA screenshots into your assistant's prompt. With MCP your assistant queries the same structured data the web app reads, and grounds its answers in what is happening in your pipelines rather than in what you remember to share.
- Which AI assistants work with the CI/CD Watch MCP server?
- Any MCP-compatible client. The ones we have explicit setup steps for are Claude Desktop, Claude Code, Cursor, Windsurf, and GitHub Copilot (VS Code 1.101 onwards, JetBrains IDEs, Visual Studio, and the Copilot CLI). Other clients work the same way as long as they accept an HTTP MCP server with a Bearer token, which is the standard transport. There is nothing assistant-specific in the protocol itself.
- Do I need to install anything to use the MCP server?
- No. The MCP server is hosted; there is no local server, Docker container, or extension to install. The setup walkthrough (config block, file paths per client, API key creation) lives on the buyer-facing companion page at /use-cases/ai-assisted-development.
- What data can my AI assistant actually see?
- The same eight surfaces the web app exposes: recent pipeline runs, connected providers, DORA metrics, cost analysis, performance analysis, audit runs, individual audit run detail, and audit findings filtered by state or pillar. It cannot write anything; the tools are read-only by design, so an assistant cannot trigger reruns or change settings even if asked.
- Does the assistant get my customer's data?
- It gets your tenant's data, scoped by the API key. The key you create has read access to your tenant only; it cannot see other tenants. Free-tier callers see counts rather than full evidence on audit findings; paid tiers see the full payload. Treat the API key as a credential and rotate it the way you would any other secret.
- What is the CLI for if I have the MCP server?
- Agents that prefer a binary over a protocol use the CLI. The cicd binary ships nine subcommands covering the same surface as the MCP tools, plus a TUI dashboard. Most teams use the MCP server day to day and reach for the CLI when scripting against the API from CI workflows themselves or when wiring CI/CD Watch into agentic frameworks that do not yet support MCP.
- Does this make my assistant write better code?
- It makes the assistant's answers about your pipelines accurate. Whether that translates to better code depends on what you ask. Questions like 'why is this test flaky' or 'what does this workflow's rerun rate look like' get grounded answers instead of plausible-sounding guesses. Code suggestions that act on real DORA or stability signals are stronger than suggestions that ignore them.
Read on
This page covers the concept: why AI-assisted development amplifies rather than fixes a team’s practices, what the eight signals are that an assistant needs to read, and the anti-pattern of measuring AI throughput instead of delivery outcomes.
For the buyer-facing version, including the MCP setup walkthrough, plan/pricing, and the per-assistant integration shapes, read CI/CD for AI-assisted development. For the canonical MCP server reference (config blocks, file paths per client, full tool schemas), see the MCP server docs. For the DORA framing this page leans on, read DORA metrics.