For AI-assisted development
CI/CD for AI-assisted development: give your assistant the context it's missing
Your AI coding assistant is making decisions about your codebase without seeing your CI/CD state. Wire the CI/CD Watch MCP server in and the assistant queries pipeline runs, DORA metrics, costs, performance analysis, and audit findings as typed tools. Eight read-only tools, two-minute setup, works with Claude Code, Cursor, Windsurf, GitHub Copilot, and any MCP-compatible client. For the conceptual framing on why this matters under DORA 2025, see AI-assisted software development.
MCP tools available to your AI assistant
MCP integration · CLI alternative · Two-minute setup
Three capabilities AI-assisted teams come back to
The CI/CD Watch product surface is the same whether a human or an AI assistant is reading it. Three capabilities the MCP integration lights up out of the box.
Eight tools, all read-only
The assistant sees the same data the platform team sees.
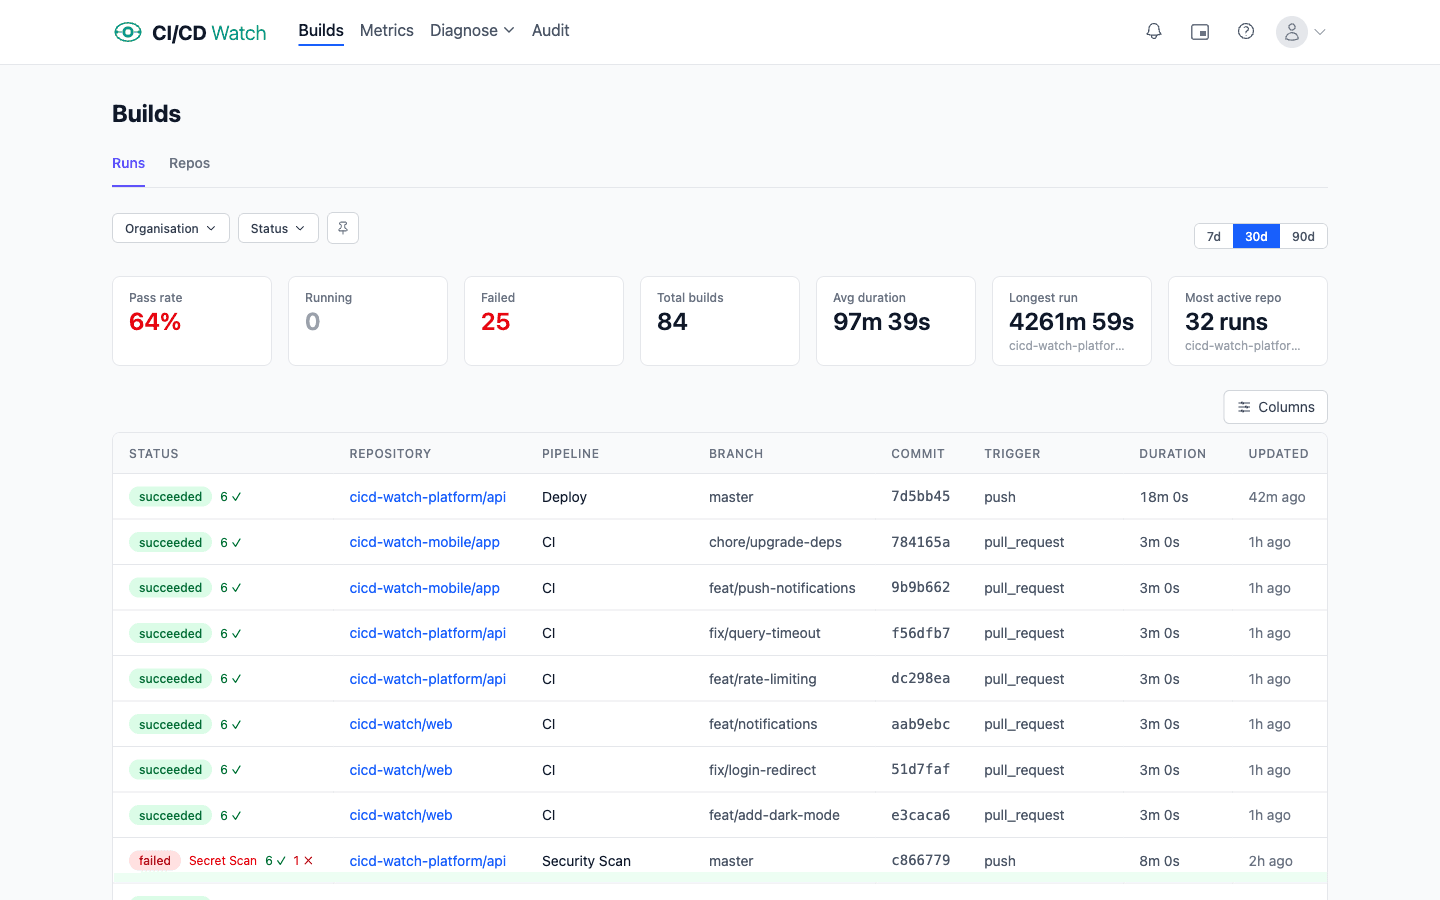
The MCP server exposes eight tools: list-runs, list-connections, get-dora-metrics, get-costs, get-performance, list-audit-runs, get-audit-run, list-audit-findings. Every tool returns the same normalised shape the web app uses, across the six supported providers. The assistant cannot trigger reruns or change settings; tools are read-only by design.
- Five analytical tools (runs, DORA, costs, performance, connections)
- Three audit tools (runs, run detail, findings filtered by state / pillar / rule / org / repo)
- Same provider-normalised data the web app shows, no per-provider quirks in the assistant's prompt
Outcome: the assistant answers questions about your pipeline state with grounded data instead of guesses.
What's needed: A CI/CD Watch tenant with at least one connected provider. Free tier is enough to validate the integration end to end.
Setup walkthrough
Two minutes per client, no local server, no agent install.
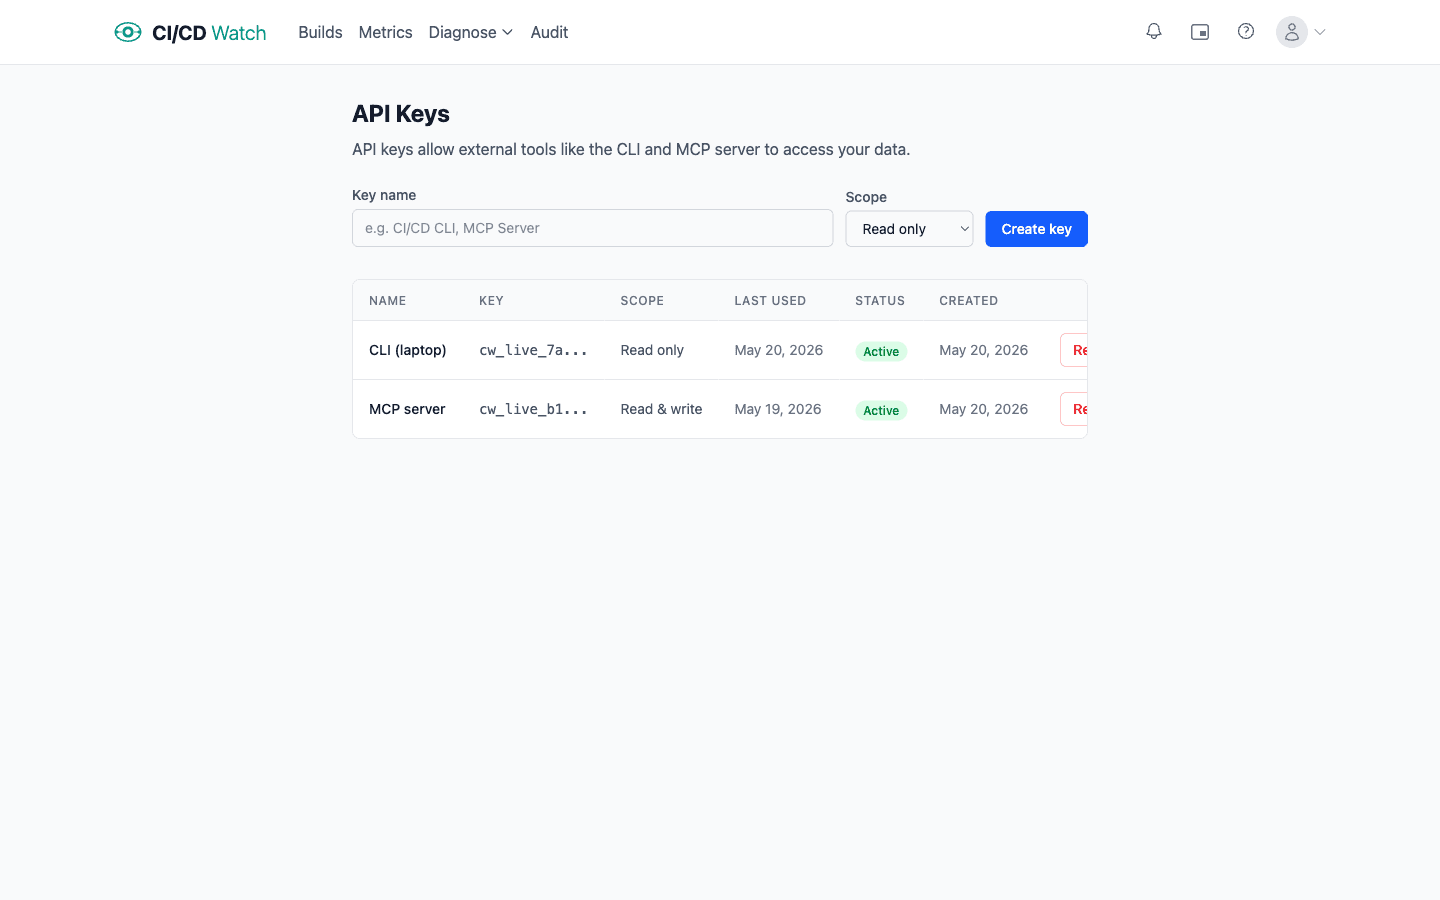
Create an API key in Settings, API Keys, add the MCP server block to your client's config file, restart the client. The server is hosted on cicd.watch infrastructure, so there is nothing to install locally. The full per-client walkthrough lives in the MCP server docs.
- Per-client JSON config block for Claude Code, Claude Desktop, Cursor, Windsurf, GitHub Copilot, Cline
- Per-client file paths documented in the docs; restart the client and the eight tools appear
- API keys scoped to your tenant, revocable from the Settings page
Outcome: every AI assistant on the team picks up your CI/CD state without per-developer setup beyond the config paste.
What's needed: An MCP-compatible client (Claude Code, Cursor, Windsurf, GitHub Copilot, or any other), a CI/CD Watch API key with read scope.
CLI for agentic frameworks
When the agent prefers a binary over a protocol.
The cicd CLI covers the same data surface as the MCP server, packaged as a single Go binary. Nine subcommands (login, runs, run, connections, repos, dora, costs, performance, dashboard) plus a live TUI. The four analytical commands share a filter shape so the agent scopes queries the same way across views.
- Nine subcommands covering runs, DORA, costs, performance, and connections
- Shared filter flags (--period, --providers, --orgs, --repo) across analytical commands
- Use when your agentic framework does not speak MCP yet, or when wiring CI/CD Watch into a CI workflow
Outcome: agentic frameworks that pre-date MCP still get the full data surface, via the binary instead of the protocol.
What's needed: A Go toolchain to install via go install, or the prebuilt binary. Same API key as the MCP server.
Same connect, more depth
What else AI-assisted teams find useful
Three more capabilities the MCP integration covers once the basics are wired in. Each pays off particularly well when the assistant is making decisions that touch CI/CD.
Read-only by design
No write actions, ever
Every MCP tool returns data. None of them trigger reruns, change settings, or alter connections. An assistant can ask whether a workflow is flaky and what its rerun rate looks like; it cannot kick off a retry on its own. The read-only design is structural, not a setting you can toggle off by accident.
Audit findings via MCP
Surface pipeline hygiene to the assistant
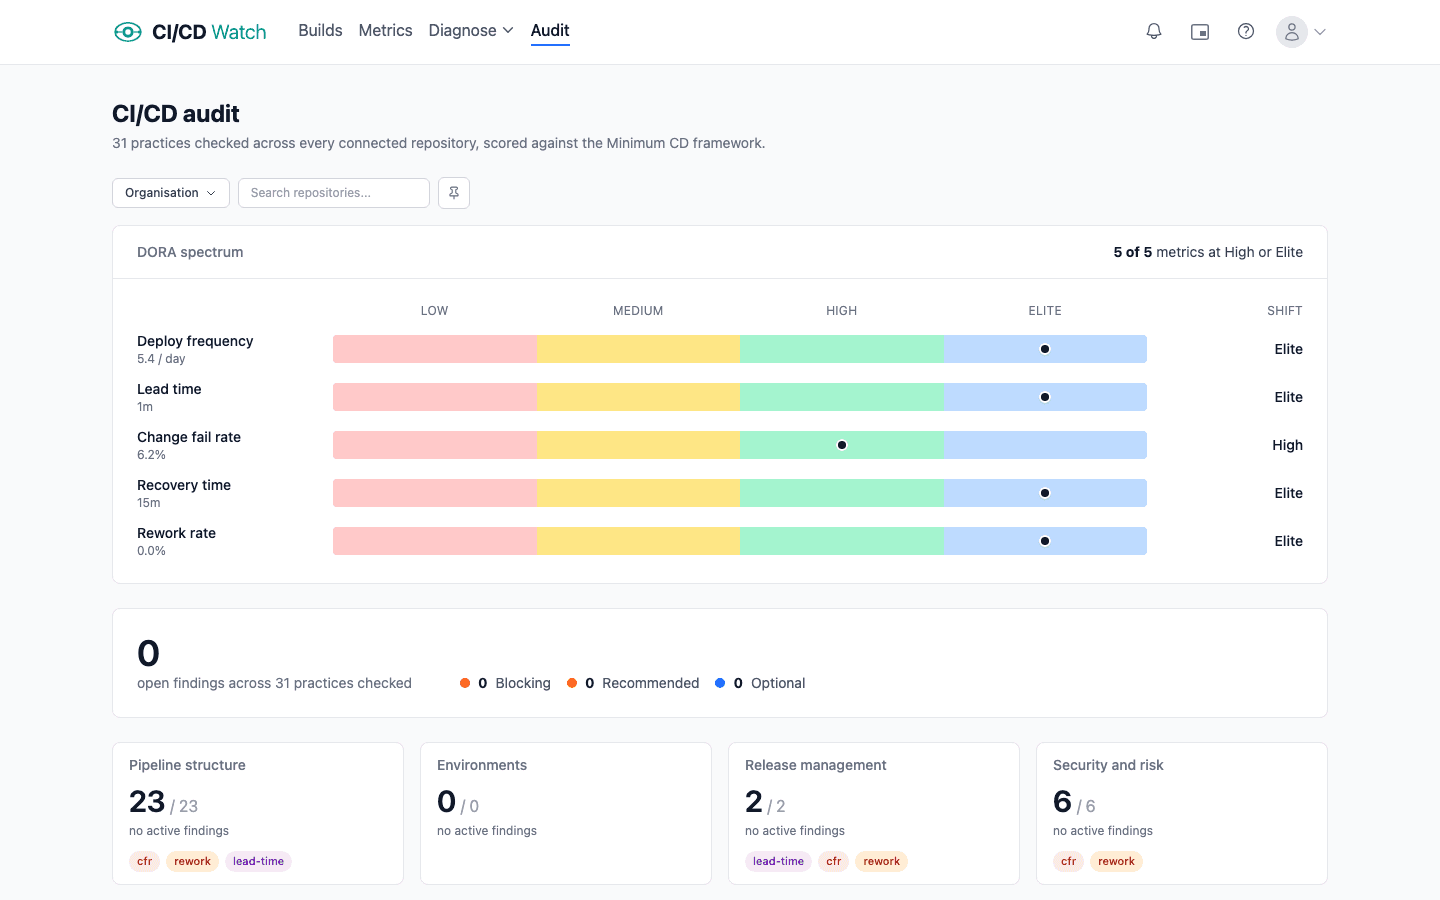
The audit pillar evaluates seven categories (tests, lint, supply chain, workflow efficiency, flaky-test handling, process hygiene, cost waste) and produces findings with severity and evidence. An assistant suggesting workflow changes can query list-audit-findings first and propose fixes the platform team has already greenlit.
DORA grounded suggestions
Assistant proposals that respect your delivery metrics
An assistant can call get-dora-metrics and reason about whether a proposed change would help or hurt lead time, change failure rate, or rework rate. Suggestions for matrix expansion look different when the assistant can see the workflow is already in the slow tier; suggestions to merge before a flake clears look different when the change failure rate is trending up.
All from one connect
The rest of the surface area
The MCP server is the headline integration. The same connect gives you the rest of CI/CD Watch through the web app, the API, and Slack notifications. Everything reads normalised data across the six supported providers.
Cost tracking →
Compute charges plus developer wait time, queryable by your assistant via get-costs. Team tier.
PR health →
CI failure rates, reviewer wait time, and PR-to-deploy latency. Team tier.
Stability classification →
Healthy, flaky, or broken per workflow. Visible to the assistant via list-runs.
Performance ratings →
Median and p95 duration, rating tier, and trend. Available via get-performance.
Security insights →
SAST, SCA, secrets, container scanning detection. MTTR by severity. Business tier.
Audit findings →
Pipeline hygiene checks across seven pillars. Queryable via list-audit-findings. Business tier.
Slack notifications →
Pipeline alerts in your team channel for the humans alongside the assistant. Team tier.
CLI →
Same data surface as the MCP server, packaged as a Go binary for agentic frameworks.
Pricing
Flat per tenant
Start free to validate the MCP integration. Team and Business are flat monthly rates per tenant. Enterprise is custom for organisations needing SSO, audit logging, and security review.
Free
For one team validating the integration with up to 3 repos.
- 3 repos
- 1 team member
- Pipeline-run monitoring
- MCP server access (list-runs, list-connections)
- Audit findings: counts only
Team
Flat rate per tenant. Up to 20 repos and 10 team members.
- 20 repos
- 10 team members
- Everything in Free
- DORA, costs, performance via MCP
- Per-test stability classification
- Slack notifications
Business
Flat rate per tenant. Up to 100 repos and 50 team members.
- 100 repos
- 50 team members
- Everything in Team
- Full audit findings with evidence
- Security insights (SAST, SCA, secrets, container)
- Priority support
Comparison
How CI/CD Watch compares for AI-assisted development
The MCP server space is filling up. Most options are locked to one provider's platform. Headline shape only; deeper feature breakdowns live on the linked pages.
CI/CD Watch$29 / mo flat (Team) | GitHub MCP serverBundled with GitHub plan | Harness MCP serverBundled with Harness platform | Datadog MCP serverBundled with Datadog CI Visibility | |
|---|---|---|---|---|
| CI providers covered | Six, normalised (GitHub Actions, GitLab CI, Bitbucket Pipelines, CircleCI, Azure DevOps, Jenkins) | GitHub Actions only | Harness only | Per Datadog CI Visibility scope |
| DORA metrics via MCP | Yes, normalised across providers | No | Yes, within Harness (SEI module) | No |
| Cost data exposed to assistant | Yes, compute + developer wait time | No | Yes, via Cloud Cost Management | No |
| Audit findings | Yes, seven pillars with severity and evidence | Limited (Dependabot, security) | Yes, via SCS | No |
| Read-only by design | Yes | No, read + write | Opt-in via env variable | Read-focused |
| Setup shape | API key, paste JSON config block | OAuth, GitHub-tied | Platform onboarding | Datadog account, platform onboarding |
Provider-locked options also include CircleCI MCP and Azure DevOps MCP. Both follow the GitHub MCP shape: bundled with the parent platform, scope limited to that provider. Competitor pricing reflects each vendor's bundled-with-platform model; none of these MCP servers are sold as separate SKUs.
8
Read-only MCP tools
6
Supported CI/CD providers
~2 min
to wire into any MCP client
0
Local servers or agents to install
FAQ
AI-assisted development specifics
- What does CI/CD Watch give an AI coding assistant that it doesn't already have?
- Structured access to your pipeline runs, DORA metrics, costs, performance analysis, and audit findings. The assistant calls eight read-only MCP tools and gets the same normalised data the web app renders, across GitHub Actions, GitLab CI, Bitbucket Pipelines, CircleCI, Azure DevOps, and Jenkins. Without that, the assistant guesses from whatever logs or screenshots you happen to paste into the chat.
- Which AI coding assistants does this work with?
- Any MCP-compatible client. Claude Desktop, Claude Code, Cursor, Windsurf, and GitHub Copilot (VS Code 1.101+, JetBrains, Visual Studio, Copilot CLI) have explicit setup paths in the docs. Other MCP clients use the same shape; Claude-family and Cursor / Windsurf use a top-level mcpServers key, VS Code Copilot uses servers. The eight tools work the same way wherever they are called from.
- How long does setup take?
- Roughly two minutes per client. Create an API key in Settings, paste a five-line JSON block into your client's MCP config file, restart the client. The MCP server is hosted on cicd.watch infrastructure, so there is nothing to install locally.
- Is this safe to point at production data?
- Yes. All eight MCP tools are read-only by design. An assistant can query everything the platform team queries but cannot trigger reruns, change connections, or alter settings. API keys are scoped to your tenant only and can be revoked at any time from Settings.
- What if my agentic framework doesn't speak MCP yet?
- Use the CLI. The cicd binary covers the same data surface as the MCP server with nine subcommands (login, runs, run, connections, repos, dora, costs, performance, dashboard) and a live TUI. Agents that run shell commands can call it directly.
- Which plan do I need?
- The Free tier covers pipeline-run monitoring, which is enough to validate the MCP integration end to end before paying for anything. DORA metrics, cost analysis, performance analysis, and the rich audit findings live on Team and above. Free-tier callers see counts only on audit findings; paid tiers see the full evidence payload.
- How does this relate to DORA 2025?
- The 2025 DORA Report on AI-Assisted Software Development frames AI as an amplifier of existing practices rather than a fix. A team with strong CI/CD signals gets more value from AI assistance because the feedback loop is fast and reliable. Giving the assistant direct read access to those signals lets it ground its suggestions in the same data the platform team uses, instead of guessing from prompt context.
- How fresh is the data the assistant sees?
- Tool calls return whatever is current in CI/CD Watch's data store, which syncs from each provider via ETag-based conditional polling on a per-connection schedule. New pipeline runs typically appear within a minute or two of completing on the provider; DORA, cost, and performance aggregates refresh on their own cadence (hourly to daily depending on the metric). For specific freshness questions on a given tool, the MCP response includes the data window the calculation covers.
- Can I scope the assistant to one tenant when I work across several?
- Yes. Create one API key per tenant in the tenant's Settings, and configure your MCP client to use the matching key. Claude Code, Cursor, and GitHub Copilot (via .vscode/mcp.json) all support per-project MCP config, so you can scope the assistant to the right tenant per repo. Other clients use the global config; in that case use the workspace switcher in your client to pick which connection is active.
Read on
The concept, the docs, the reference
Guide
AI-assisted software development
The conceptual framing: amplification thesis, what signals matter, the anti-pattern of measuring AI throughput. Read this if you want the why before the how.
Guide
MCP server reference
The canonical setup walkthrough: config blocks, per-client file paths, the eight tools with their inputs and outputs.
Guide
CLI reference
Nine subcommands, shared filter flags, and the live TUI dashboard for agents that prefer a binary over a protocol.
Guide
DORA metrics
The five metrics an MCP-connected assistant queries via get-dora-metrics. Definitions, traps, and how to read them together.
Guide
Audit
How CI/CD Watch audits pipelines for missing tests, missing lint, supply-chain risks, and other hygiene gaps. The same findings the assistant queries via list-audit-findings.
Guide
Public API
REST endpoints covering the same data surface as the MCP server. Use when an agent or workflow needs raw HTTP rather than the MCP protocol.
Explore other use cases
See how CI/CD Watch helps every role in your engineering org.
For Developers
Real-time build monitoring, PiP mode, and test failure drill-downs.
For Engineering Managers
DORA metrics, trend charts, and delivery insights across teams.
For Platform, DevOps & SRE
Multi-provider consolidation, stability classification, and optimisation suggestions.
For Tech Leads
CI cost tracking, waste detection, and PR health monitoring.
For DevSecOps
Inventory security control coverage across every repo. Find gaps and copy-paste the fixes.
Give your assistant the context it's missing.
Connect a provider in two minutes, create a read-scope API key, paste the MCP config block. Your assistant starts answering grounded questions about your pipelines on the next prompt.