An engineering leader is asked to "start tracking DORA metrics" and goes looking for DORA metrics tools. A browser full of tabs opens: an engineering-intelligence platform built on Git activity, a deployment tracker that wants webhooks, an observability suite with a CI module, and their own providers' native analytics. Every one of them shows a deployment-frequency chart in the demo. None of the demos answer the question that actually matters: can this tool read the data we already produce, across the providers we actually run, and turn it into numbers we can defend in a board review?
That is the right way to choose among DORA metrics tools. The dashboards all look similar because the four-to-five headline numbers are standardised. What separates the tools is upstream of the chart: where the data comes from, how each metric is defined, and what it costs to keep the pipeline of numbers flowing. This is a buyer's guide to those differences, framed as the questions to ask before the pricing conversation. It assumes you already know what DORA metrics are; if not, start there and come back.
What a DORA tool has to produce
DORA is five metrics, split across two dimensions. Two measure throughput: deployment frequency and lead time for changes. Three measure stability: change fail rate, failed deployment recovery time (the metric long known colloquially as MTTR), and deployment rework rate, which joined the framework in 2024. A tool that only reports the original four is reporting an older version of the framework. A tool that reports throughput without stability is showing you half the picture, which is the half that makes shipping faster look unambiguously good.
Every credible DORA tool computes some version of these five. The differences that matter are not in the definitions on the marketing page. They are in the plumbing behind them.
The questions that separate DORA metrics tools
1. Which data source does it read?
This is the first and most decisive question, because it determines whether the numbers reflect what actually happened. Tools fall into a few camps. Git-centric platforms read pull request and commit data from your source host and infer delivery performance from Git activity. Deployment trackers take an explicit deploy event, often via webhooks or a CLI call your pipeline makes. Observability suites read CI spans emitted by instrumentation. Provider-native analytics read whatever that one provider knows about its own runs. A pipeline-native tool reads the CI/CD run history directly from each provider's API.
The distinction is not academic. A Git-centric tool can tell you when a pull request merged but not whether the deploy that followed actually succeeded, because the deploy happened in a system it does not watch. A deployment tracker only knows about deploys you remembered to report to it. Ask what the tool would miss if a team forgot to wire it up, and you will quickly see how trustworthy its numbers are.
2. Does it unify multiple providers, or silo them?
Most organisations past a certain size run more than one CI/CD provider: a GitHub Actions majority with some Jenkins holdouts and a GitLab CI team that arrived through an acquisition. If a tool reports DORA per provider, you are back to stitching three partial answers into one number by hand, and the stitching is where the definitions quietly drift apart. The question to ask is whether the tool pools every provider onto one timeline with one deployment rule, so that "deployment frequency" has a single defensible answer. This is the specific problem that measuring DORA across multiple providers runs into.
3. How does it define each metric?
The definitions look clean until you measure a real estate. When does the lead-time clock start: first commit, pull request open, or merge to main? What counts as a deployment: a tag, a job named a certain way, or a run that reached a named environment? Where does change fail rate get its failure signal from: a rollback, a linked incident, or a manual flag? Two tools reporting "lead time for changes" can produce numbers that differ by a day depending on these choices. A good tool documents its answers and lets you adjust them; a weak one hides them. Measuring DORA metrics in practice covers the contested definitions in full.
4. What does setup cost you?
Instrumentation burden is a recurring tax, not a one-off. Some tools need an agent installed in every runner, or a deploy-marker call added to every pipeline, or spans emitted from CI configuration you maintain forever. Each of those is a change your team has to make and keep working as pipelines evolve. A read-only integration that pulls run history from the provider API asks nothing of your pipeline files. When you weigh setup, count the ongoing maintenance, not just the first afternoon.
5. How does the price scale?
DORA tools price on different axes, and the axis matters more than the headline rate. Per-contributor and per-committer models scale the bill with the size of your engineering organisation. Usage-based models scale it with pipeline volume, which is hard to forecast. Flat per-tenant models hold steady as the team grows inside a tier. None is inherently right, but the model determines whether the cost is predictable a year out. Verified base rates for the common tools sit on the individual comparison pages; treat any figure you cannot trace to a vendor's own pricing page with caution.
The categories of DORA tooling
Grouping the market by data source rather than by brand makes the trade-offs legible:
- Provider-native analytics. GitHub, GitLab, and others report on their own runs for free. Accurate for that provider, blind to every other, and no help to a mixed estate.
- Git-centric engineering intelligence. Platforms like LinearB derive delivery metrics from pull request and commit activity. Strong on developer-workflow analytics, but they read Git, not pipeline execution.
- Deployment-centric DORA trackers. Tools like Sleuth treat each deploy as an event and connect it to incidents. Good at the deployment story; dependent on that deploy event being reported.
- Full-stack observability suites. A CI module inside a larger platform, such as Datadog CI Visibility, correlates CI data with infrastructure and traces. Powerful if you already live in that suite, and priced accordingly.
- Purpose-built CI/CD monitoring. Reads CI/CD run history across providers and derives the five metrics from it directly, with no extra instrumentation. This is the category the next section is written from.
How CI/CD Watch approaches DORA metrics
CI/CD Watch, a CI/CD observability platform that monitors pipelines across GitHub Actions, GitLab CI, Bitbucket Pipelines, CircleCI, Azure DevOps, and Jenkins, answers the data-source question by reading each provider's run history through its API. There is no agent to install in your runners and no deploy marker to add to your pipeline files; the connection is a read-only OAuth grant, and polling uses conditional requests so it stays within provider rate limits. What the pipeline already records is the data the metrics are built from.
Every connected provider feeds one model, so a deployment rule applies the same notion of "reached production" regardless of which provider ran the pipeline, and lead time uses the same clock-start across all of them. The five DORA metrics are derived once over the pooled timeline rather than read from each provider's native analytics and reconciled by hand. The metrics are a signal your team acts on, not a verdict: the point of a defensible deployment-frequency number is the conversation it starts about batch size, not the number itself.
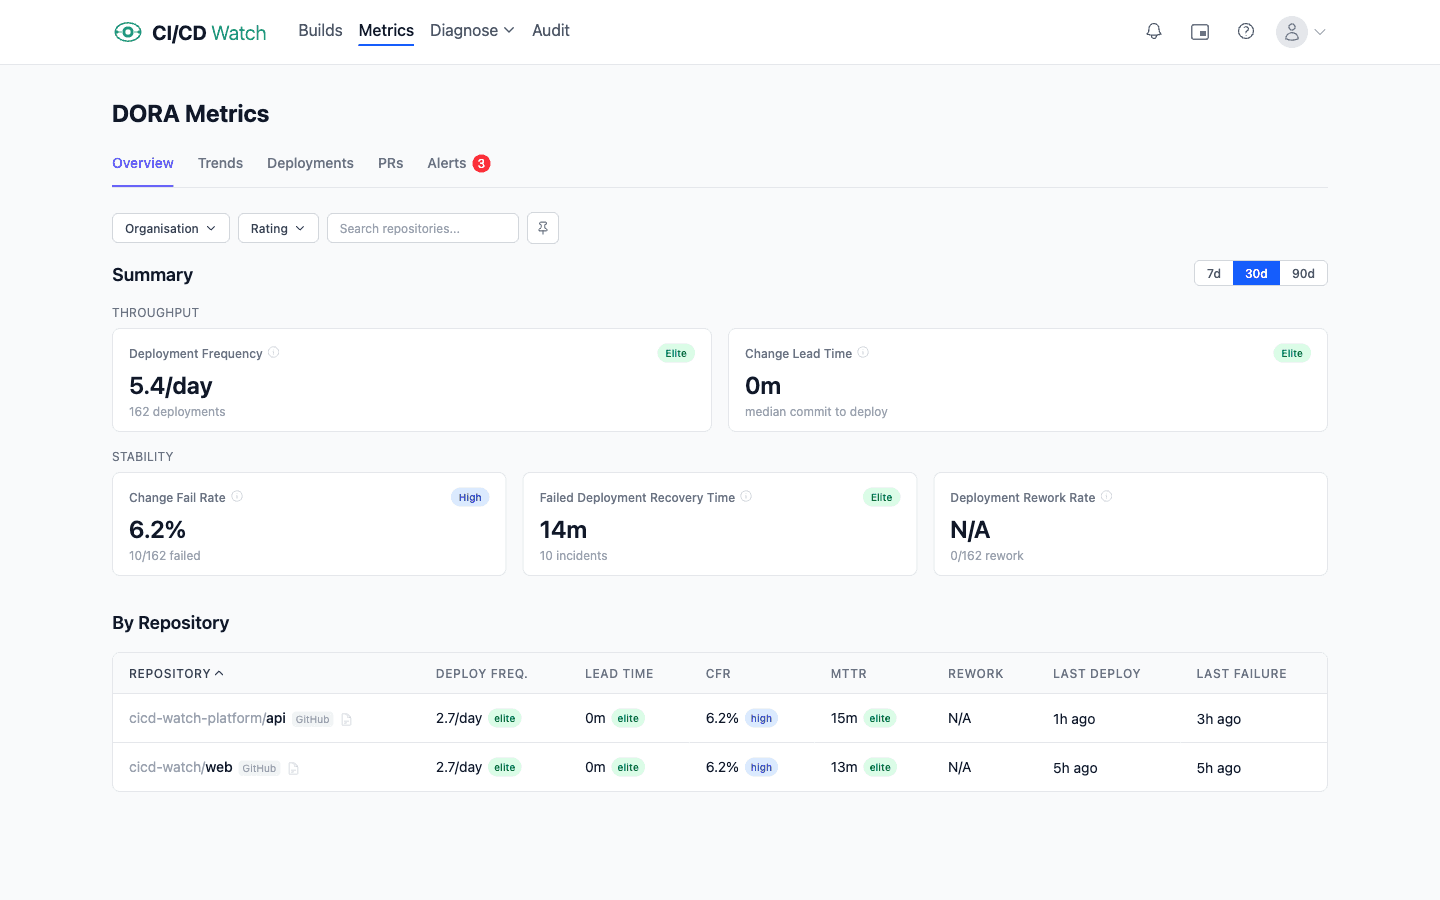
On cost, CI/CD Watch is flat per tenant rather than per-contributor or usage-based: the Free tier covers pipeline-run monitoring across all six supported providers, and the unified DORA view with Elite / High / Medium / Low banding sits on the Team plan and above. The bill does not move with committer count or pipeline volume inside a tier, which is the predictability point from question five. How each metric is calculated, including the deployment-rule model, is documented in the DORA metrics reference.
Start tracking DORA metrics
Choose on the data source first, the metric definitions second, and the price model third; the dashboard is the least important part, because they all draw the same five charts. If your estate spans more than one provider and you want the numbers derived from the CI/CD data you already have, connect a provider and see the pooled view. The Free tier covers pipeline monitoring; the DORA analysis layers on from the Team plan. For the framework these tools measure against, the DORA metrics overview covers all five; the wider CI/CD monitoring picture shows where DORA fits alongside cost and stability.
CI/CD Watch is built by 3CS Technologies Ltd. It started as an internal tool for tracking pipeline health across a mixed GitHub Actions and Jenkins estate. The same engine now powers the SaaS platform.