A platform team runs forty repositories. Most build on GitHub Actions, a dozen legacy services still deploy from Jenkins, and an acquired team brought GitLab CI with them. Leadership asks a simple question: what is our deployment frequency? There is no single answer. GitHub gives one number through its insights, Jenkins needs a plugin and a spreadsheet, GitLab has its own analytics tab, and none of the three knows the others exist. The team has three partial pictures and no way to add them up.
Measuring DORA metrics across multiple CI/CD providers is the normal case, not the edge case, and per-provider measurement fragments the signal. The five metrics only mean something at the team or organisation level when deploys from every provider are normalised to the same definitions and pooled into one timeline. Measure each provider on its own terms and you get numbers that cannot be compared, cannot be summed, and quietly mislead.
This is the measurement problem behind multi-provider delivery: why estates end up on more than one provider, why the native analytics cannot combine, the three things you have to normalise (deployment definitions, commit attribution, and the pooled timeline), and what you can and cannot honestly compare once you have.
Multi-provider is the norm, not the exception
Few engineering organisations of any size run a single CI provider end to end. The estate accretes. A company standardises on GitHub Actions but keeps a Jenkins fleet alive for the services nobody wants to touch. An acquisition arrives with GitLab CI and its own pipelines. A platform team pilots a migration that runs both the old and new provider in parallel for a year. Each of these is a normal stage in a real delivery estate, and each leaves you measuring delivery performance across two or more providers at once.
The DORA framework is provider-agnostic by design. It measures the deploy loop, not the tool that runs it. So in principle a deployment is a deployment whether it shipped from GitHub Actions or Jenkins. In practice, getting the providers to agree on what a deployment is, and lining their timelines up, is the entire job.
Why per-provider DORA fragments the signal
Each provider's native analytics sees only its own pipelines. GitHub's insights cannot count a Jenkins deploy; GitLab's analytics tab has never heard of your GitHub Actions workflows. So a team on three providers gets three deployment-frequency numbers, three lead-time numbers, and no legitimate way to combine them into the one figure leadership actually asked for.
Naive summing makes it worse, not better. Add three deployment-frequency counts together and you have a number that depends entirely on each provider defining "deployment" the same way, which they do not. Average three lead times and you have hidden the one team whose lead time is a week behind a slow review queue. Fragmented metrics do not just under-inform; assembled carelessly they actively mislead, because the assembly step is where the definitions silently diverge.
The three things you have to normalise
Turning N per-provider pictures into one honest set of numbers comes down to three normalisation problems. Get these right and the metrics pool cleanly; get any one wrong and the combined number is fiction.
1. Deployment definitions differ per provider
"What counts as a deployment" is the most contested DORA question on a single provider, and multi-provider multiplies it. The providers do not even offer the same primitives. Bitbucket Pipelines has first-class deployment environments declared in YAML, so the deploy signal is explicit. GitHub Actions expresses deployments as workflow runs, sometimes against named environments, sometimes not. GitLab CI has environments and a deployments API. Jenkins has whatever the freeform job happens to do. To compare deploy frequency across them you need one rule that maps each provider's primitive onto the same notion of "reached production," rather than trusting each provider's default. The cleanest approach is a per-service deployment rule, applied uniformly, that names which signal on each provider counts as a deploy. How that is configured is covered in the deployment detection reference.
2. Commit-to-deploy attribution differs per provider
Change lead time is the interval from a commit being authored to that change reaching production. Computing it means linking a deploy back to the commits it carried, and every provider exposes that linkage differently: some attach the triggering commit SHA to the run, some expose it only through the source repository, some lose it behind a manual trigger. To get a lead-time number that means the same thing across providers, the commit-to-deploy join has to be reconstructed on the same basis everywhere, with the clock starting at the same point. The decisions behind that join, including where the clock starts, are treated in how to measure DORA metrics.
3. Pooling into one timeline
Once deployments and lead times mean the same thing on every provider, they have to land on a single timeline to produce a team or organisation number. That means agreeing the unit of aggregation (per service, per team, per org), deduplicating deploys that a chained or mirrored pipeline records twice, and using a consistent window so a provider with a weekly release train is not compared against one deploying continuously. Pooling is where the deployment-frequency sum and the change-fail-rate ratio finally become legitimate, because every contributing deploy was counted by the same rule before it entered the total.
What you can and cannot compare across providers
Normalisation makes the combined number honest. It does not make every cross-provider comparison meaningful. Two comparisons are safe and one is a trap.
Safe: the pooled trend. Once definitions match, the org-level DORA trend over time is the number leadership wanted, and it is legitimate. Is combined deployment frequency rising? Is pooled change fail rate falling? Those answer the real question.
Safe: each provider's own trend.A given provider's metrics tracked against itself over time are fine, because the definition is held constant within that provider. The Jenkins fleet getting slower quarter over quarter is a real signal.
Trap: ranking providers against each other.Concluding that "GitHub Actions teams ship faster than Jenkins teams" from the numbers almost always measures which teams run on which provider, not the provider itself. The legacy services on Jenkins are legacy for reasons that have nothing to do with the runner. DORA is a diagnostic for the delivery system, not a league table for tools.
How CI/CD Watch unifies DORA metrics across multiple providers
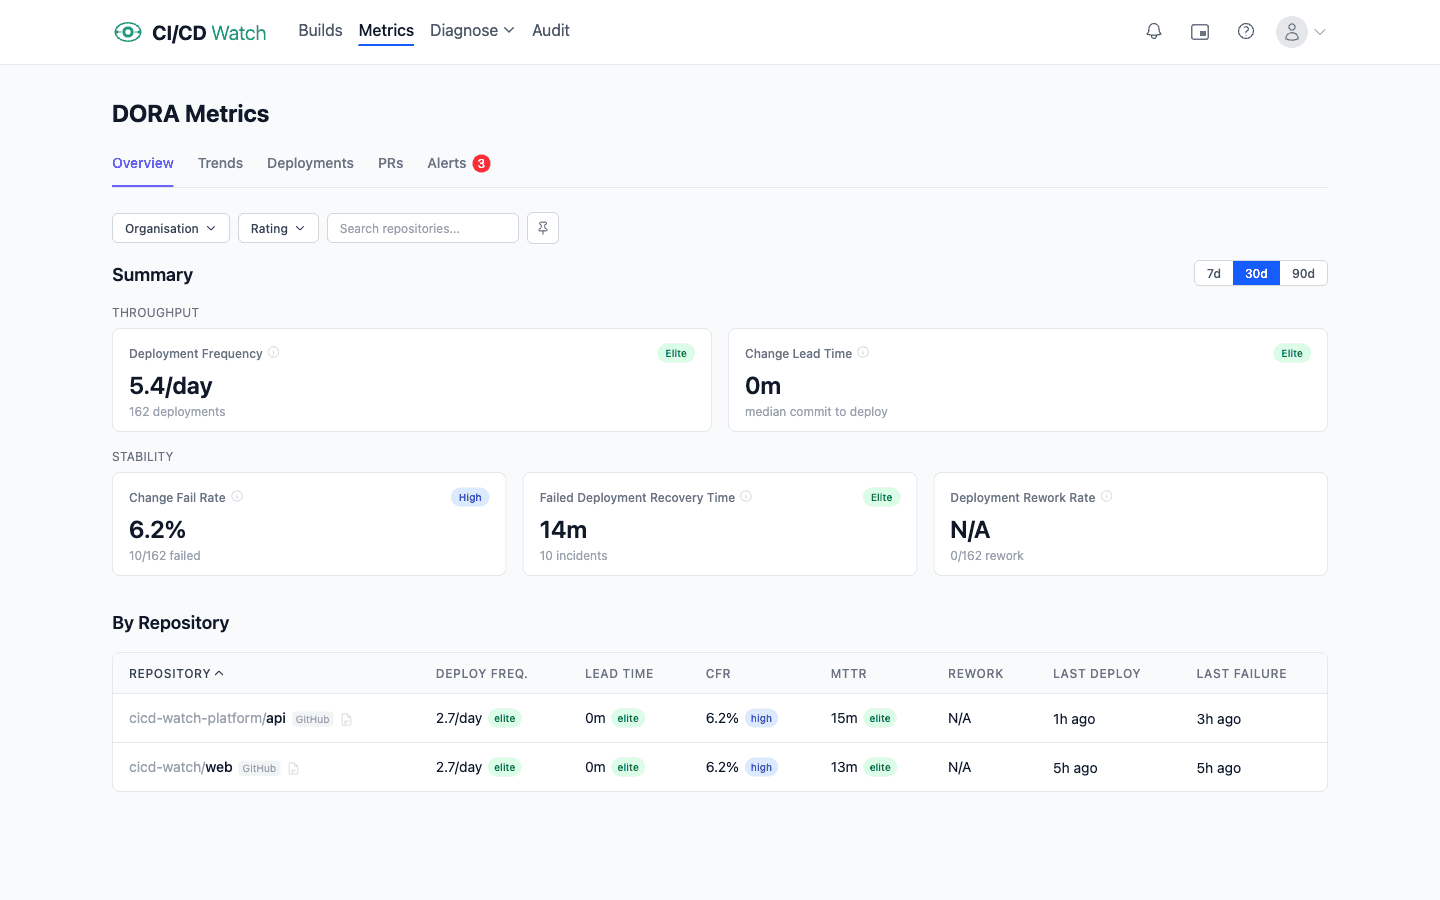
CI/CD Watch, a CI/CD observability platform that monitors pipelines across GitHub Actions, GitLab CI, Bitbucket Pipelines, CircleCI, Azure DevOps, and Jenkins, exists to solve the pooling problem. Every provider connects into one model, so a deployment rule defined per service applies the same notion of "reached production" regardless of which provider ran the pipeline. Lead time uses the same clock-start across all of them. The five DORA metrics are then derived once, over the pooled timeline, rather than read from each provider's native analytics and stitched together by hand.
The practical upshot for a mixed estate is that the deployment-frequency question has a single answer again, and the answer is defensible because every deploy in it was counted by the same rule. How each metric is calculated, including the deployment-rule model that makes cross-provider pooling work, is documented in the DORA metrics reference. The unified DORA view sits on the Team plan and above; the Free tier covers pipeline-run monitoring across every connected provider, which is enough to confirm the deploy signals line up before layering DORA analysis on top.
See unified DORA metrics across your providers
If your estate spans more than one provider, connect each one and CI/CD Watch pools the deploy signals into a single set of DORA metrics on one timeline. The Free tier covers pipeline-run monitoring across all six supported providers; unified DORA trends and the Elite / High / Medium / Low banding live on the Team plan and above. For the framework these metrics sit inside, the DORA metrics overview covers all five.
CI/CD Watch is built by 3CS Technologies Ltd. It started as an internal tool for tracking pipeline health across a mixed GitHub Actions and Jenkins estate. The same engine now powers the SaaS platform.