The platform lead's morning starts with three browser tabs. The GitHub Actions tab, mostly green. The Jenkins dashboard, slow to load but no red. The GitLab pipelines view the acquired team still uses. Each one says its own corner is fine. None of them answers the only question that matters: across all of it, is the team shipping well? The answer lives in the gaps between the three tabs, and no single tab can see it.
Multi-provider CI/CD monitoring is the practice of seeing delivery health across every CI provider at once, rather than one provider-native dashboard at a time. For any organisation running delivery across more than one team, it is not a nice-to-have. A single team usually standardises on one provider; the organisation around it accumulates several, and the moment delivery spans them, per-provider dashboards stop being able to answer the question that CI/CD monitoring exists to answer. The feedback loop on your delivery practices is real, but it runs across all your providers, and a view that sees only one of them sees only part of the loop.
What follows is why multi-provider is an organisational reality, what specifically breaks when monitoring is split per provider, what good cross-provider monitoring actually shows you, and where the single-dashboard approach fits. The deeper question of how the underlying delivery metrics combine across providers is its own subject.
Multi-provider is an organisational reality
The team-versus-organisation distinction matters here. An individual team usually does standardise on one provider, and mostly should. The multi-provider reality is an organisational one: across teams, an estate accretes providers over time, for reasons that have nothing to do with indecision. A company standardises on GitHub Actions but keeps a Jenkins fleet running the services nobody wants to re-platform. An acquisition arrives with GitLab CI and a year of pipelines behind it. A migration runs the old and new providers in parallel for longer than anyone planned. Each is a normal stage in a real delivery estate, and each leaves you monitoring delivery across two or more providers at once.
The trap is treating the multi-provider state as temporary, a thing you will clean up after the migration finishes. The migration rarely finishes on schedule, the acquired team keeps shipping on its own stack, and the legacy fleet outlives three reorgs. Planning your monitoring around a single-provider future you never reach means living without a cross-provider view during exactly the period it matters most.
The sprawl carries a measurable cost, too. The CD Foundation's State of CI/CD Report 2024, drawn from SlashData surveys of more than 150,000 respondents, found that deployment performance is worse when teams run multiple CI/CD tools of the same form, attributing it to interoperability friction between them. So multi-provider is not a state to celebrate; it is one to manage. Cross-provider visibility does not erase that friction on its own. But you cannot manage what you cannot see across, and the provider-native dashboards are precisely the thing that cannot see across.
What breaks when monitoring is per-provider
Each provider's native dashboard is good at showing its own pipelines and blind to everyone else's. That blindness is fine until your delivery spans providers, at which point four specific things break.
- No unified run list. There is no single place that shows every run, across every provider, in the order they happened. Triage becomes a tab-switching exercise, and the run that matters is always in the tab you are not looking at.
- No cross-provider metrics.Deployment frequency, lead time, and failure rate each live inside one provider's analytics. The org-level number that spans all of them does not exist without stitching exports together by hand.
- Inconsistent notions of green.A passing run with an auto-rerun behind it, a flaky suite quietly retried, a manual approval gate left open: each provider reports "success" differently. Comparing health across providers means first reconciling what each one means by it.
- Fragmented alerting. Each provider notifies through its own channel and its own thresholds. The signal that should close the loop arrives in three places with three shapes, so the loop stays open.
None of these is a failing of the provider dashboards themselves. They are doing exactly what they were built to do: monitor one provider. The gap is structural. A cross-provider question needs a cross-provider view, and no amount of polish on a single-provider UI produces one.
What good multi-provider CI/CD monitoring shows you
The point of pulling every provider into one view is not a prettier dashboard. It is restoring the feedback loop that the split broke. Good cross-provider monitoring answers the questions a single-provider view cannot:
- One run list across providers, in real time, so triage starts from a single ordered feed rather than a tab sweep.
- One set of delivery metrics, pooled across providers on the same definitions, so "are we shipping well?" has an org-level answer.
- One reconciled notion of health, so a flaky-and-retried pass on one provider does not read as equivalent to a clean pass on another.
The practices-first point still applies. A unified view does not fix delivery; it surfaces the signals a team acts on. A cross-provider dashboard that nobody uses to change how they work is just three dashboards rendered in one place. The value is that the signal is finally visible in one loop, and the loop is what the team closes.
Can you just aggregate it yourself?
Often, yes, and for a while it is the right call. Every provider exposes an API, and a platform team can pull runs from each into a shared store and render them in Grafana or a BI tool over the top. If you run one or two providers and want full control of the data, that build is legitimate and worth respecting. The question is not whether you can; it is what the aggregation layer costs to keep alive.
The expense is rarely the first build. It is the maintenance. Each provider's API drifts on its own schedule, paginates differently, and rotates auth its own way. Each has a different rate-limit model, so a naive poller that works against one provider hammers another into 429s, and you end up reimplementing conditional-request caching per provider just to stay under the ceiling. Worst of all, the normalisation never sits still: every time a provider changes what a run, a deployment, or a "success" looks like, the rule that made cross-provider numbers comparable has to be re-derived and kept in sync. The aggregation layer quietly becomes a service your platform team owns and operates, competing for attention with the delivery work it was meant to support.
The honest line is the same as any build-vs-buy call. With a provider or two and a team that wants the control, build it. As providers and repositories multiply, and the rate-limit and normalisation upkeep starts outweighing the delivery value, the maintenance is the part you are actually buying out of when you reach for something off-the-shelf.
How CI/CD Watch does multi-provider monitoring
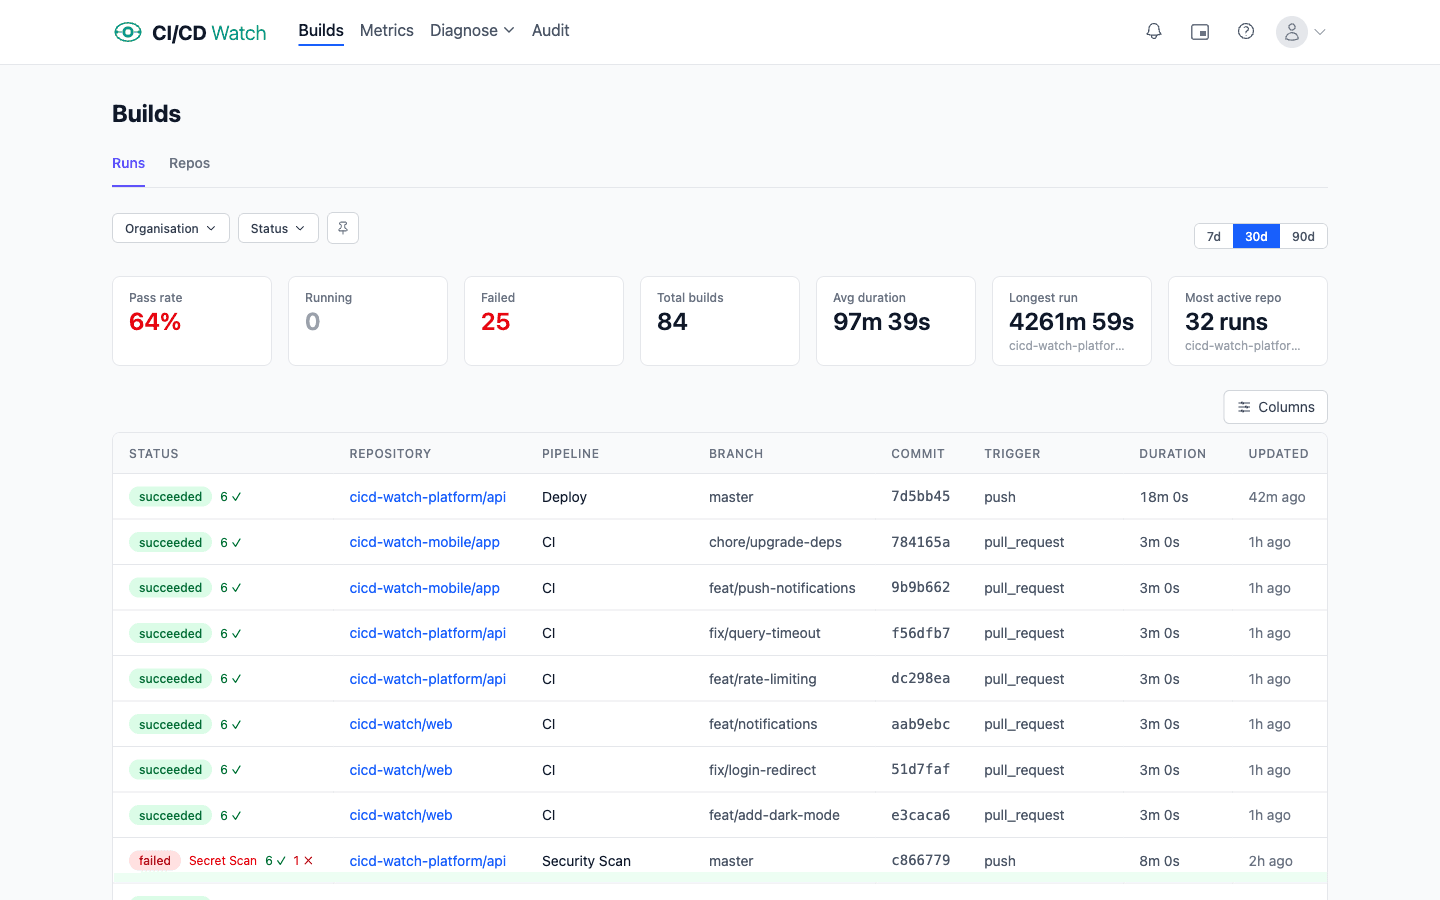
CI/CD Watch, a CI/CD observability platform that monitors pipelines across GitHub Actions, GitLab CI, Bitbucket Pipelines, CircleCI, Azure DevOps, and Jenkins, is built around the cross-provider view rather than bolted onto one provider. Every connected provider feeds one run list, one set of delivery metrics, and one notion of pipeline health, in real time. Where a build-vs-buy decision is in play, the comparison against stitching provider-native dashboards together is covered in how to build a GitHub Actions dashboard.
Real-time here means ETag-based conditional requests against each provider's API, so the unified feed updates as runs complete without polling provider APIs into their rate limits. The Free tier covers pipeline-run monitoring across every connected provider, which is the cross-provider run list itself; the analytical layer (pooled DORA metrics, cost, trends) sits on the Team plan and above. Per-provider landing pages go deeper on each: Bitbucket Pipelines and CircleCI among them.
See every provider in one view
If your delivery runs across more than one provider, connect each one and CI/CD Watch pulls every run into a single real-time feed. The Free tier covers cross-provider pipeline monitoring for small teams; pooled metrics and trends live on the Team plan and above. For the broader frame this sits inside, the CI/CD monitoring overview covers what closing the delivery feedback loop actually means.
CI/CD Watch is built by 3CS Technologies Ltd. It started as an internal tool for tracking pipeline health across a mixed GitHub Actions and Jenkins estate. The same engine now powers the SaaS platform.