CI pipeline waste is the compute you paid for and the developer time you lost on work that produced no signal anybody acted on. It is unusually easy to ignore because it never arrives as a line item. The provider invoice shows total minutes, not wasted ones, and the wait-time half never gets invoiced at all.
Five categories account for most of it, and the useful thing is not the list. It is knowing how to detect each one in your own pipelines and what the fix actually costs. The taxonomy and the compute-plus-wait model behind it are set out in the guide to CI/CD cost; what follows is the detection-and-fix pass for each category.
One principle applies throughout. Every wasted minute is billed twice: once as compute the provider charged for, and once as wait a developer paid. A fix that removes a minute removes it from both ledgers, which is why the cheap-looking categories are often worth more than the expensive-looking ones. How each side is costed is set out in the cost-calculation docs.
1. Reruns from flakiness
A flaky test fails, the pipeline reruns, the test passes, everyone moves on. The pipeline ran twice: compute doubled, wait doubled, and nothing was learned.
How to detect it. Compare the count of pipeline runs against the count of distinct commits over the same window. The gap is your rerun population. Then split it: reruns that passed on the second attempt with no code change are the flaky ones, and reruns that needed a commit in between were real failures doing their job. Only the first group is waste.
The fix, and its cost. Quarantining the worst offenders is fast and buys immediate relief, but it is a holding action: a quarantined test is coverage you are no longer getting. The durable fix is repairing the top few tests by flip rate, which is slow work that competes with feature delivery. The economics are set out in the flaky test cost breakdown, and they usually favour fixing sooner than teams expect.
2. Oversized runners
Defaults are sticky. A runner size gets chosen early, never revisited, and a workload that would finish in roughly the same wall-clock time on a smaller runner keeps running on a larger one at a higher rate.
How to detect it. Look for jobs where duration is flat across runner sizes, which means the work is not CPU-bound and the extra cores are idle. The tell is a job whose duration barely moved the last time somebody upgraded the runner. If nobody has ever changed it, run the experiment deliberately on a branch and compare.
The fix, and its cost. Rightsizing is a configuration change, so the compute saving is close to immediate. The trap is treating smaller as automatically better. Some workloads genuinely benefit from a larger runner, and buying a faster pipeline buys back wait time across everyone who was blocked on it. Rightsizing is a measurement exercise in both directions, not a cost-cutting default.
3. Dead pipelines
Workflows that run on every push but nobody reads. Nightly builds on branches nobody has merged in months. Security scans that fail silently and alert nobody. Each is compute spent on a signal with no reader.
How to detect it. Two queries find most of them. First, workflows whose failures never precede a fixing commit: if a job has been red for weeks and nothing changed in response, nobody is reading it. Second, scheduled triggers on branches with no recent commits, which is where dead runs concentrate because the team that set them up has usually moved on.
The fix, and its cost. Deleting a workflow is free and slightly frightening, which is why dead pipelines survive. The honest question is not whether the job might matter one day but whether anyone would notice it stopping. Where a scan genuinely should be read, the fix is wiring it to an alert rather than deleting it. A silently failing security scan is worse than no scan, because it produces the appearance of coverage.
4. Red-main blocks
Main is red. Nobody can merge. Every engineer waiting on a merge is blocked, and every engineer whose work depends on theirs is blocked behind them. The compute bill does not move. The wait bill is the largest of any category on this list.
How to detect it. Measure time-to-green on main: the interval between a failing run on the trunk and the next passing one. Multiply by the number of engineers who merged in that window, or would have. This is the one category where the detection method is also the business case, because the number lands with people who do not otherwise read pipeline metrics.
The fix, and its cost. Practices, not tooling. Smaller changes, a rerun policy that does not mask real breakage, and a team norm that a red trunk stops feature work until it is green. The cost of the fix is cultural rather than technical, which makes it the hardest of the five to actually land and the most valuable when it does.
5. Parallelism that does not parallelise
A matrix fans out to eight jobs. Seven finish in two minutes; one takes fifteen. The pipeline takes fifteen minutes and bills for eight jobs. The parallelism bought compute cost without buying wall-clock time.
How to detect it. For each matrix job, compare the longest leg against the median leg. A wide gap means the fan-out is paying for capacity it cannot use. The same check catches the inverse problem, where a single long job would benefit from being split but never has been.
The fix, and its cost. Rebalance the split so the legs finish together, usually by sharding the slow one rather than shrinking the matrix. This is real engineering effort against a test suite that probably resists being split cleanly, and it is worth doing only where the pipeline sits on a critical path that people wait on. The wait-time argument for prioritising it is in the developer wait time breakdown.
Which CI pipeline waste to tackle first
Order by effort against combined saving rather than by compute alone. Oversized runners and dead pipelines are configuration changes with immediate compute savings, so they go first despite being the least interesting. Reruns come next because the saving compounds across both ledgers. Red-main blocks carry the largest wait cost but need a cultural change, so start the conversation early and expect it to take longer than the technical work. Parallelism rebalancing is last, and only where the pipeline is genuinely on a critical path.
Where CI/CD Watch fits
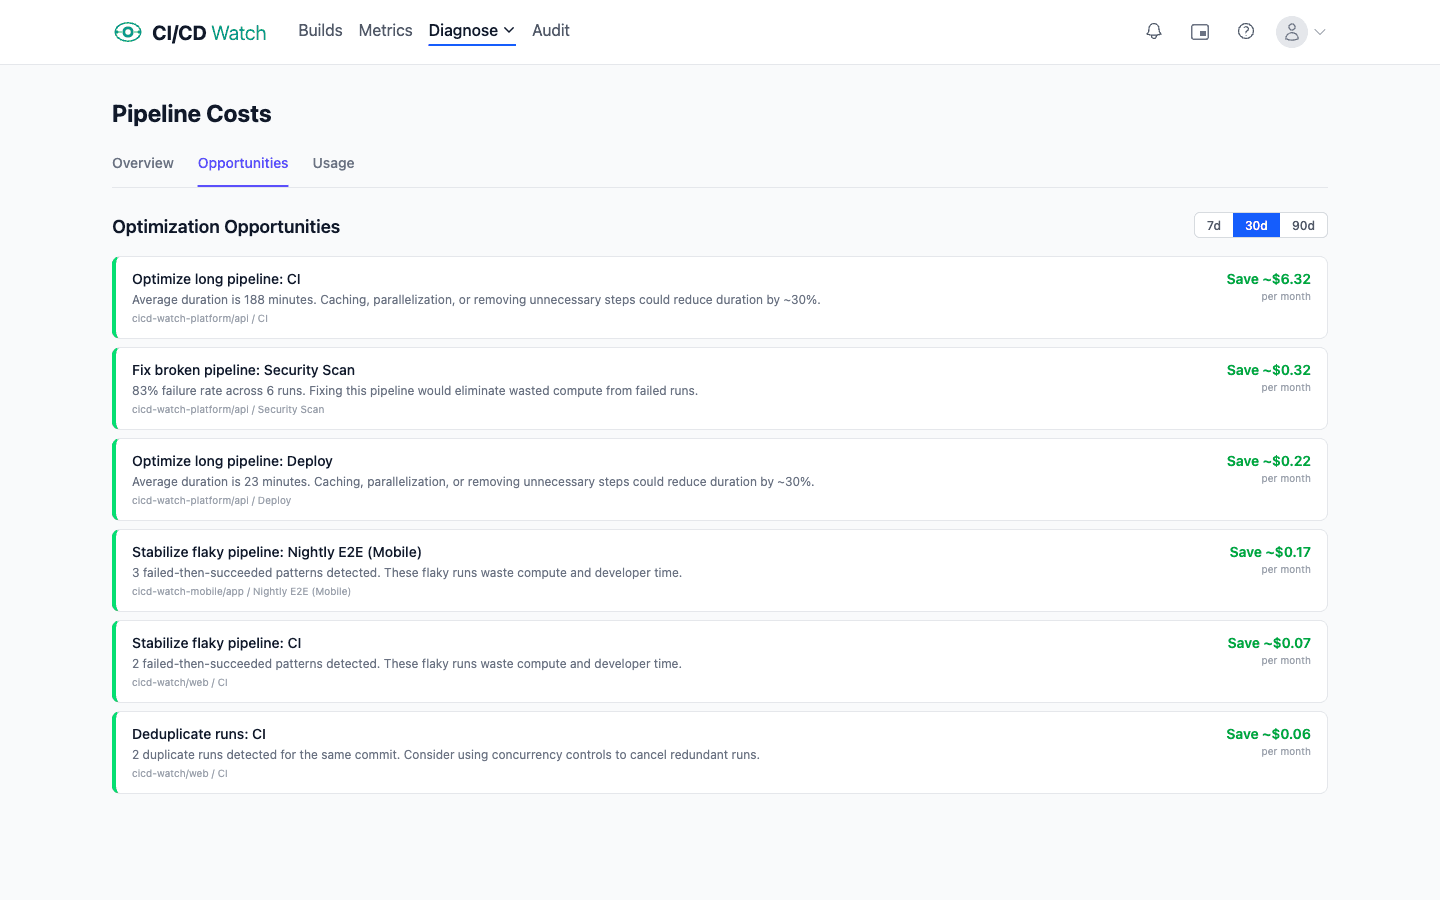
CI/CD Watch, a CI/CD observability platform that monitors pipelines across GitHub Actions, GitLab CI, Bitbucket Pipelines, CircleCI, Azure DevOps, and Jenkins, runs the detection passes above against your own run history and surfaces each waste category as an opportunity with an estimated saving, costed on both compute and wait time using rates you configure per runner type.
It does not reduce your provider bill on its own. It makes the cost of leaving each category in place legible to both Finance and Engineering, and a human decides which are worth the fix. Cost analysis sits on the paid tiers; pipeline monitoring and the run history the detection needs are on the Free tier.
Start with one window
Pick a thirty-day window and one repository that people actually wait on. Run the five detection passes against it and write down the answers, including the ones that come back clean. Most teams find two categories dominate and the other three are noise, and knowing which two is worth more than a general programme of cost reduction.
If you would rather not write the queries, connect a provider on the Free tier and let a few weeks of history accumulate first. The categories do not show up in a single week of data.
CI/CD Watch is built by 3CS Technologies Ltd, a UK consultancy that has run pipeline audits across regulated programmes and now runs the same engine inside the SaaS platform. We treat developer wait time as a first-class cost category because that is where most of the true cost of CI/CD turns out to sit.