An engineer pushes a commit on a 20-minute pipeline and opens the runs page. The build queues for four minutes. It executes for sixteen. A flaky test fails on the first run, so they click rerun and wait again. By the time the pipeline is green, forty minutes of their working day have gone. Multiply that across a hundred engineers pushing three times a day and the arithmetic becomes uncomfortable.
Developer wait time in CI is the dominant component of CI/CD cost for almost every team larger than a few people. It is also the one component Finance never sees, because no provider sends an invoice for it. The number is large and invisible at the same time, which is the specific combination that keeps it unmanaged.
That framing sits inside the broader true cost of CI/CD. What follows goes one level deeper on the wait-time side: what counts as waiting, what the maths actually looks like on real workloads, and what to measure to make the number visible. On one customer workload we measured a wait-to-compute ratio of 100 to 1; the worked example sits below.
Why wait time is paid but never invoiced
Compute cost arrives once a month with a line-item breakdown and lands in whichever accounting code Finance has set up for it. Because it has an invoice, it gets managed: someone reviews spend, someone asks why it grew, someone proposes a cap.
Developer wait time is paid out of salaries. An engineer on a $75-per-hour fully-loaded cost is paid that rate whether they are writing code or staring at a pipeline. The money leaves the business either way, but only the compute half carries a receipt. Nobody sends your CFO a bill for the forty minutes an engineer spent waiting on a run to go green.
The effect is predictable. Teams optimise the visible number and ignore the larger invisible one. A quarterly cost review might shave 15% off the GitHub Actions invoice and be written up as a success, while the wait-time cost sitting behind the same pipelines is an order of magnitude or two larger and never comes up.
What counts as waiting: the taxonomy
Pipeline duration is the obvious component of wait time, but it is not the only one. Several other categories sit around the run itself and cost the team the same hourly rate.
- Queue time. The minutes between a workflow being triggered and a runner picking it up. Often invisible in the provider UI. On busy repositories during peak hours, queue time can exceed execution time, and a developer staring at a queued badge is paid the same as one staring at a running build.
- Execution time. The pipeline run itself. Wait cost scales with p95 more than median: the slow runs are the ones that block the team, and they are what developers feel.
- Reruns from flakiness. Every rerun pays the full execution cost again on both compute and wait. On a customer workload in a recent 30-day window we observed a 3.7% rerun rate, roughly one commit in twenty-seven paying double. The arithmetic is unpacked in the real cost of flaky tests.
- Manual-gate wait. Deployment approvals, required reviewer checks, release windows, synchronous CAB-style forums, per-change pen testing on changes that did not architecturally need it. Engineering leaders often treat these as human time rather than CI time. By any honest accounting they are wait cost: the pipeline has stopped, the engineer cannot progress, the meter is still running. In regulated programmes this category is frequently the largest single line item in the wait-time taxonomy, and the one that goes unmeasured because it lives in calendars and tickets rather than in the pipeline log.
- Red-main blocks. When main is red, every engineer waiting to merge is blocked; every engineer whose branch depends on the broken code is blocked on them. One hour of red main on a 100-engineer team at $75 per hour is $7,500 of pure wait cost, and the compute bill does not move at all.
- Context-switch cost. Returning to deep work after an interruption takes roughly twenty minutes. A pipeline that forces an engineer away from their editor for ten minutes can easily cost thirty minutes of real productivity on either side of the break.
Only the first three show up in a naive duration dashboard. The last three are why cost models that look only at average pipeline time consistently underestimate what wait costs.
The maths, and how it scales
The back-of-envelope formula is straightforward:
wait time cost per day = pipeline duration × engineers blocked × commits per engineer per day × hourly rate
Plug in a 20-minute pipeline on a 100-engineer team pushing three times a day at a fully-loaded rate of $75 per hour and the daily cost lands at $7,500. Over a 250-day work year that is roughly $1.9 million. The same workload on a GitHub-hosted Linux runner at $0.008 per minute comes to about $12,000 per year in compute: two orders of magnitude smaller.
The sensitivity is where the argument becomes load-bearing. The wait-time number scales linearly with every input, and each input is something a typical organisation either already has or could realistically grow into.
| Team size | Pipeline duration | Hourly rate | Annual wait cost |
|---|---|---|---|
| 20 engineers | 10 min | $75/hr | ~$190,000 |
| 50 engineers | 15 min | $75/hr | ~$700,000 |
| 100 engineers | 20 min | $75/hr | ~$1,875,000 |
| 100 engineers | 20 min | $100/hr | ~$2,500,000 |
Every row uses three commits per engineer per day and 250 working days. Context-switch cost is excluded, so the real figures run higher. Even halving each number to account for partial productivity during waits leaves every row larger than almost any team's CI compute bill.
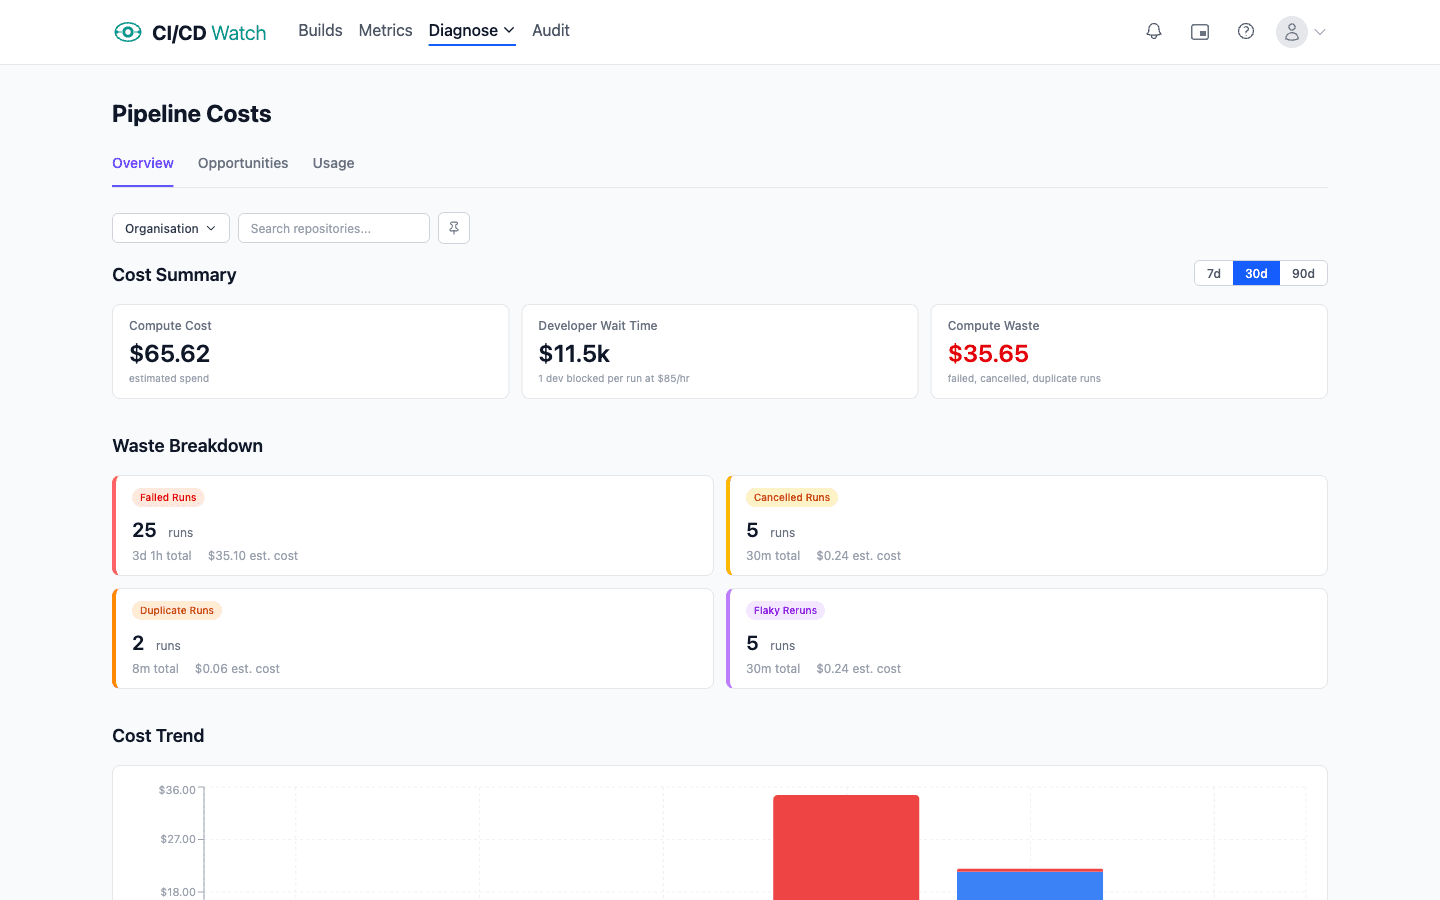
On one customer workload (14 repositories, 378 terminal runs in a 30-day window) we measured a wait-to-compute ratio of 100 to 1. Annualised, that translates to about $200 in runner minutes against $20,000 in developer wait time on a workload the team considered healthy.
When compute actually wins
There is a narrow case where the compute cost of slow CI pipelines exceeds wait cost: a very small team (one or two engineers) on an already-fast pipeline, running heavy macOS workloads on GitHub-hosted Apple silicon runners. A single-engineer team cannot accumulate more wait cost than one engineer's hourly rate, so the team-size multiplier that dominates elsewhere is missing. For everyone else, the wait side is larger by at least an order of magnitude, usually more.
What to measure to make developer wait time in CI visible
Four numbers explain most of what you will find the first time you look at wait-time data honestly.
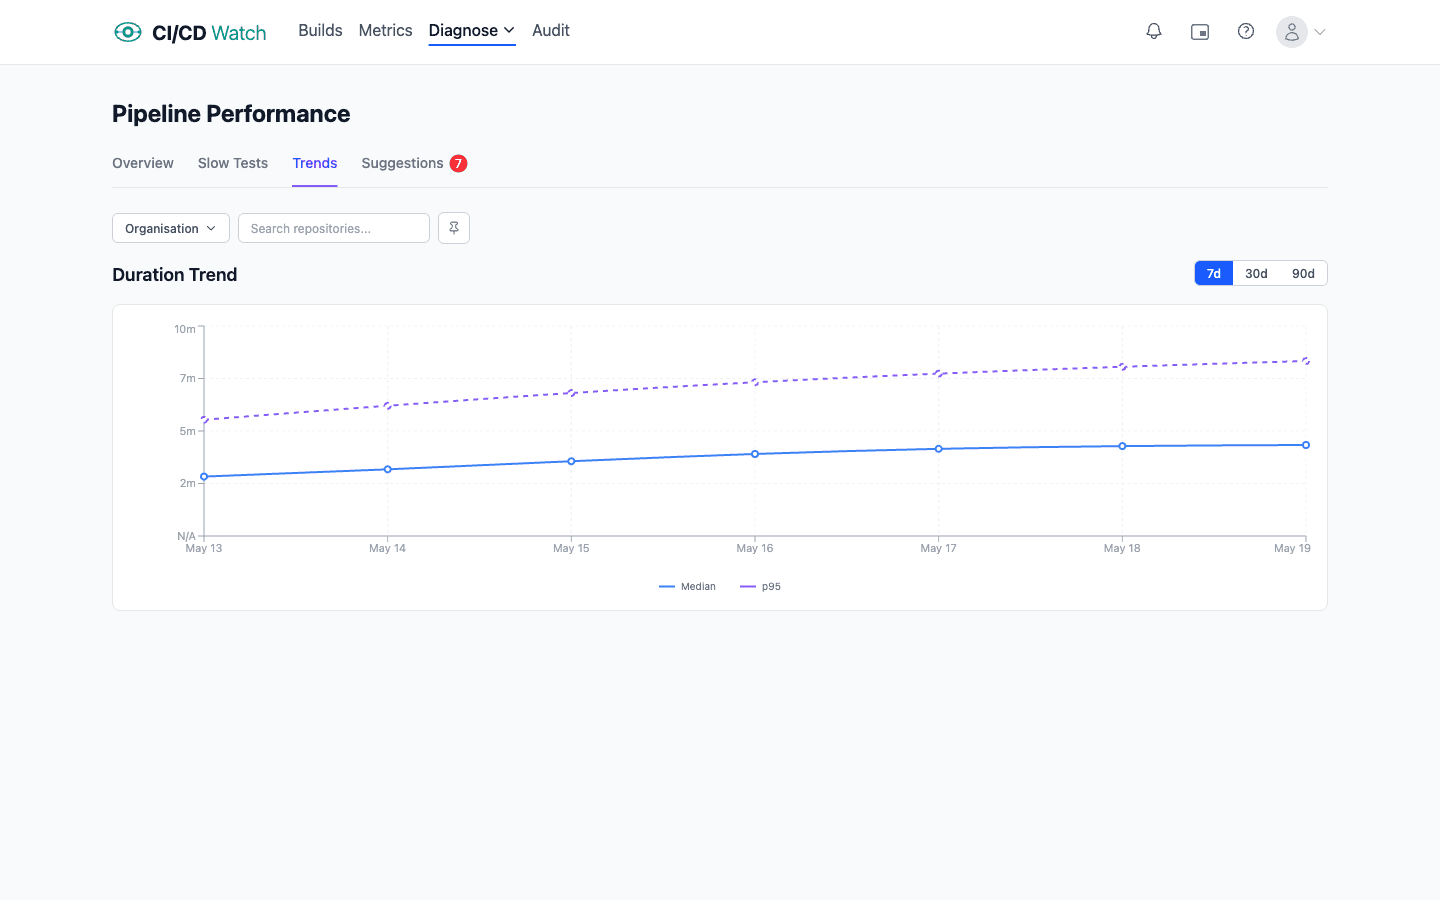
- p95 pipeline duration over 30 days. The tail, not the median, is what developers feel. Track it week on week so drift becomes visible before it becomes a culture problem.
- Queue time distribution. Often invisible in the provider UI. Large queue times are either a runner capacity problem or a concurrency-limit problem, and both are cheap to fix once measured.
- Rerun rate per workflow. Every rerun pays both sides of the ledger twice. A workflow with a 15% rerun rate is paying a 15% tax on every run.
- Wait-time cost per run, at a defensible hourly rate. Even a rough rate (market median for your region) reveals the right order of magnitude and gives you a number to compare against the compute invoice.
None of these requires an expensive tool. They can be pulled from each provider's API or billing export with a modest amount of scripting. The harder problem is keeping them current, and keeping them comparable across providers when a team runs more than one.
Wait time also feeds DORA metrics. Long pipelines lengthen change lead time; rerun-heavy workflows inflate it further. A team that already tracks lead time is already tracking a proxy for pipeline wait, whether they realise it or not.
How CI/CD Watch surfaces developer wait time
CI/CD Watch, a CI/CD observability platform that monitors pipelines across GitHub Actions, GitLab CI, Bitbucket Pipelines, CircleCI, Azure DevOps, and Jenkins, computes wait time from pipeline duration and your team's configured hourly rate, then rolls it up the same way as compute: per workflow, per repository, per provider, across whatever window you ask for. The formulae and assumptions behind each number live in the cost-calculations reference.
Wait time is never treated as derived from compute. The two numbers sit side by side on the same dashboard, with the same waste categories (reruns, oversized runners, dead pipelines, red-main blocks, parallelism gaps) expressed as both a compute figure and a wait-time figure, so the cost of leaving any category in place is legible to both Finance and Engineering.
Practices matter more than tooling here. Trunk-based development with small, frequent merges shortens each pipeline's validation window. Fast, reliable tests remove the rerun tax. A branching model that treats main as always-shippable removes the red-main-block category of wait cost entirely. Tooling compounds those gains; it does not replace them.
See wait-time cost on your own pipelines
CI/CD Watch's Free tier covers pipeline monitoring for small teams. Connect a provider and see every workflow run across every repository in one dashboard, part of the broader true cost of CI/CD picture. Wait-time analytics and the full cost breakdown live on the Team plan and above.
CI/CD Watch is built by 3CS Technologies Ltd. It started as an internal tool for tracking pipeline health across a mixed GitHub Actions and Jenkins estate. The same engine now powers the SaaS platform.