Cost Calculations
Poor CI/CD pipelines cost far more than the runner bill suggests. The real cost is twofold: the compute resources consumed by every run, plus the developer time lost waiting for results. CI/CD Watch tracks both so you can see the true price of slow, flaky, or failing pipelines.
Compute Cost
CI runners charge per minute of execution time. Every pipeline run, including failed and duplicate ones, burns compute. CI/CD Watch uses the following default rates:
| Provider | Rate per minute |
|---|---|
| GitHub Actions | $0.008 |
| GitLab CI | $0.005 |
| Bitbucket Pipelines | $0.006 |
| CircleCI | $0.006 |
| Azure DevOps | $0.005 |
| Jenkins | $0.005 |
Compute cost for a run is simply the total duration multiplied by the provider's per-minute rate. For pipelines with multiple jobs, each job's duration is summed individually. You can override these default rates in Settings → Cost Rates to match your actual compute costs.
Developer Wait Time
Every minute a pipeline runs is a minute a developer is blocked, waiting for tests to pass, builds to complete, or deployments to finish before they can move on. CI/CD Watch values this at $75/hr by default, based on a fully loaded engineering cost.
For most teams, developer wait cost far exceeds the compute bill. A 15-minute pipeline that costs $0.12 in compute costs $18.75 in developer time, over 150× more. This is the hidden cost that makes pipeline optimization so impactful.
Not every build has a developer actively waiting. CI/CD Watch automatically excludes unattended runs from the wait time calculation, scheduled (nightly/cron) builds, API-triggered rebuilds, downstream pipeline triggers, Jenkins SCM polling, and chained workflow runs. These still count toward compute cost, but are not counted as developer wait time.
Where Costs Appear
CI/CD Watch surfaces cost data in context throughout the app, so you see the financial impact alongside the metrics you're already reviewing.
- Performance
- Total cost and cost per run for each pipeline, with a job-level breakdown of compute cost vs developer wait time.
- Stability
- Estimated waste from flaky and broken pipelines, showing how unreliable pipelines translate into real dollars lost.
- Flaky Tests
- Estimated waste from test failures, helping you prioritize which flaky tests to fix based on their cost impact.
- Costs
- Overall summary with waste breakdown, cost trends over time, and optimization suggestions ranked by potential savings.
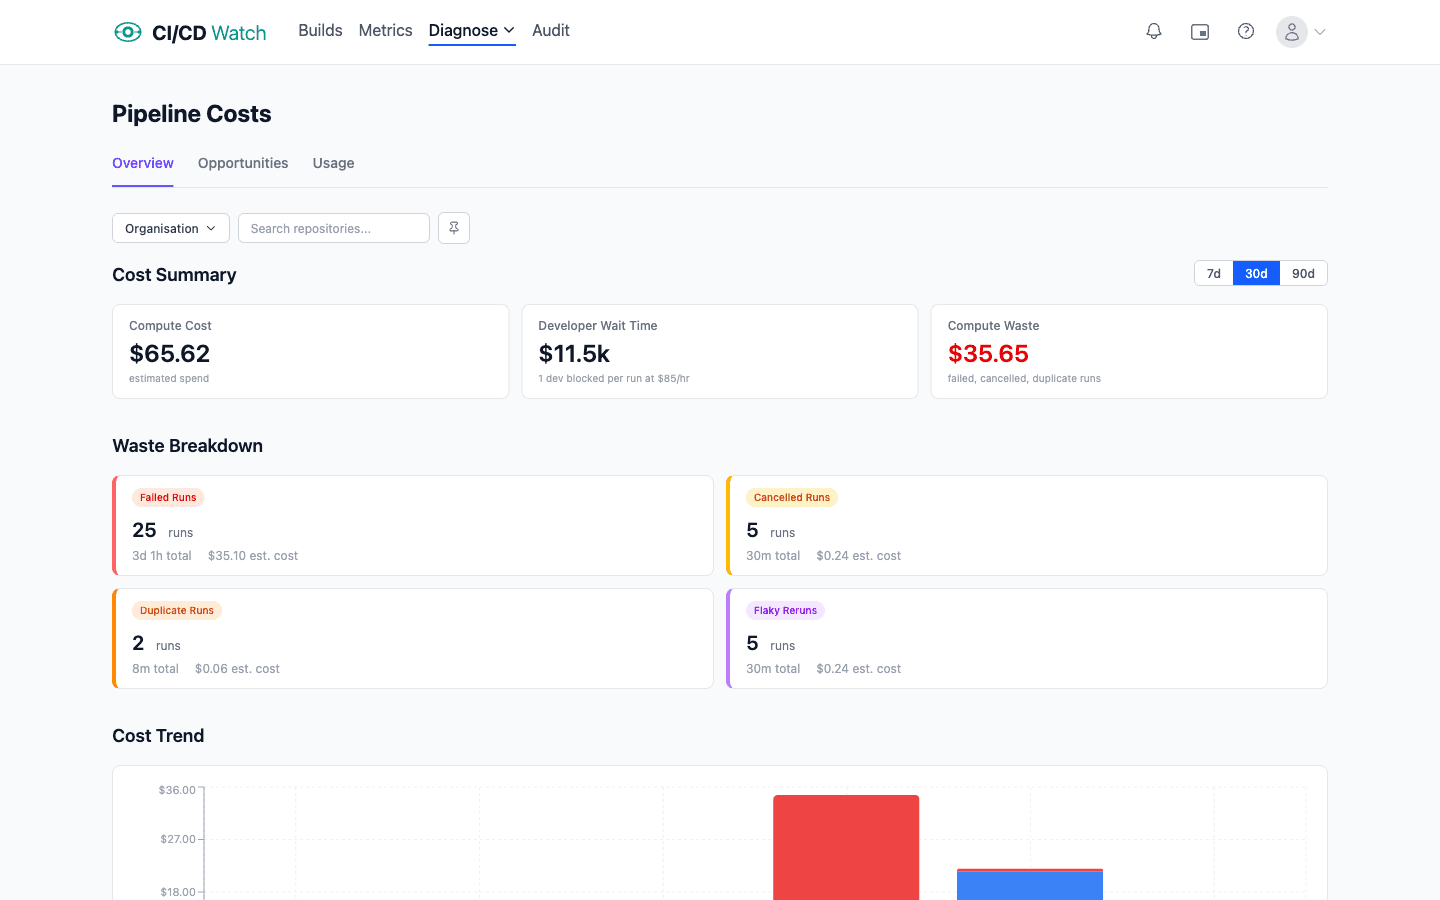
Waste Categories
CI/CD Watch automatically detects four types of waste in your pipeline runs:
- Failed runs
- Runs that completed with a failure status. The compute and wait time spent on these runs produced no deployable result.
- Cancelled runs
- Runs that were manually or automatically cancelled before completion. Any time already spent is wasted.
- Duplicate runs
- Runs triggered on the same commit within 5 minutes of each other. These typically happen when a pipeline is re-triggered accidentally or by misconfigured webhooks.
- Flaky reruns
- A failure followed by a success on the same commit within 30 minutes. This pattern indicates a flaky test or transient infrastructure issue rather than a real code problem, the failed run was unnecessary waste.
Cost Opportunities
The cost opportunities page (under Costs → Opportunities) surfaces actionable savings ranked by potential impact. These are specific pipelines or patterns where reducing waste, optimizing duration, or fixing flaky tests would save the most money.
Each opportunity shows the estimated saving, making it easy to prioritize which pipelines to improve first. Analyze across 7, 30, or 90-day windows to see how cost patterns change over time.
The Compounding Effect
Slow pipelines discourage small, frequent commits. When developers batch up changes to avoid waiting, they create larger, riskier deployments. Larger changes fail more often, take longer to debug, and require more reruns, which makes the pipeline even slower.
This creates a vicious cycle: slow pipelines → larger batches → more failures → longer recovery → more cost. Cost visibility helps break this cycle by showing exactly where time and money are being lost, making it easier to justify targeted improvements to the pipelines that matter most.
Related
- Pipeline Stability , how flaky and broken pipelines drive up waste costs
- Flaky Tests , test-level cost impact and flaky rerun waste
- Performance Ratings , optimisation suggestions to reduce pipeline duration and cost
- PR Health , developer wait time on pull requests
- Cost Rate Settings , customise compute and developer hourly rates