Someone senior asks whether the AI coding tools are worth what the company pays for them. A dashboard gets opened. It reports an acceptance rate, a count of lines accepted this month, and an estimate of hours saved per developer. Everyone nods. Nobody can say whether the team is shipping better software than it was before the tools arrived, because none of those numbers describe shipping.
Measuring AI coding productivity does not need new metrics. It needs the five DORA metrics, applied to the team rather than to the assistant. That is an unfashionable position in 2026, when a steady genre of writing argues that AI has broken the DORA model and something new is required. The opposite is closer to true: AI assistance is exactly the kind of change the DORA metrics were designed to evaluate, and the vendor scores offered as replacements measure activity that has never correlated with delivery. The conceptual frame for this sits in the guide to AI-assisted software development; what follows is the measurement problem in detail.
What the assistant dashboards actually count
Assistant telemetry is generous, because it is cheap to collect. The IDE knows what it suggested and whether the keystroke that followed was a tab or a delete. From that, four families of number get reported:
- Acceptance rate. The share of suggestions a developer accepted rather than dismissed.
- Volume accepted. Lines, characters, or completions that made it into the editor.
- Suggestions merged. Accepted code that survived as far as a merged branch.
- Time saved. A modelled figure, usually volume accepted multiplied by an assumed typing or authoring rate.
These are activity metrics. They describe what happened inside the editor. Delivery happens well downstream of the editor, and nothing in that list crosses the gap.
Four ways acceptance rate misleads
Acceptance rate is the metric most often promoted to a productivity proxy, so it is worth being specific about how it fails. Each failure is a different measurement error, which matters because they cannot be corrected by the same adjustment.
It counts input, not output. A suggestion accepted in the IDE is not a deployment that landed safely in production. Between the two sit code review, the test suite, the pipeline, and whatever happens in the first hour after release. Accepting more code faster moves work into that pipeline; it does not tell you what came out.
It rewards verbosity. Volume accepted goes up when the assistant writes long, and a longer solution is not a better one. A developer who uses an assistant to delete two hundred lines of duplicated logic scores badly on every volume metric while doing the most valuable work of the week.
It cannot see rework. Accepted code that gets rewritten next sprint counts once as acceptance and never again as cost. This is the error that compounds: the faster a team accepts, the more rework it can generate, and the acceptance metric reports the acceleration while staying silent on the consequence.
It is trivially gameable once measured. The moment acceptance rate appears on a slide with someone's name next to it, it stops measuring anything. This is not a cynical observation about developers; it is what happens to any activity metric attached to an incentive.
The pattern across all four: these numbers are easy to extract, hard to interpret, and actively misleading when read as productivity.
The attribution trap
A tempting middle path is to keep the DORA metrics but split them by author: deployment frequency for AI-assisted changes against deployment frequency for hand-written ones, change failure rate for each, and so on. It sounds rigorous. It is a trap, for three reasons.
The attribution itself is unreliable. Real changes are mixed. A developer drafts with an assistant, rewrites half of it, accepts a refactor suggestion, then hand-edits the tests. There is no honest label for that commit, and any heuristic that assigns one is inventing a boundary that did not exist while the work was happening.
The split also measures the wrong unit. DORA metrics are team and system metrics. Change failure rate describes what happens when a team's changes reach production, which depends on the test suite, the review culture, the deployment mechanism, and the rollback path far more than on who typed the diff. Slicing a system metric by authorship produces two numbers that are both mostly about the system.
Finally, it recreates the individual-productivity framing that made activity metrics harmful in the first place. Once a dashboard can show that one developer's AI-assisted changes fail more often, the conversation stops being about delivery and starts being about people. Measure the team, and the question stays answerable.
Measuring AI coding productivity with the five DORA metrics
The DORA metrics measure the right thing for the AI era for the same reason they measured the right thing before: deployment frequency, lead time for changes, change failure rate, mean time to recovery, and deployment rework rate all care about whether code reaches production safely, not about who or what wrote it. Definitions and the traps in each live in the DORA metrics reference. What matters here is that authorship is not an input to any of them, which is precisely why they survive a change in who is doing the authoring.
Read as a set, they also make the trade-off visible. Throughput without stability is the failure mode AI assistance invites: a team that ships more changes per week while breaking production more often has not become more productive, and only the pairing of deployment frequency against change failure rate and deployment rework rate will show it. A vendor productivity score has no stability half.
Which metrics move first
If AI assistance is helping, the five metrics do not all respond at the same time, and knowing the order stops teams drawing conclusions too early.
Lead time for changes tends to move first, because that is where drafting speed lands. It is also the least interesting signal on its own, since a shorter authoring step can be absorbed entirely by a slow review or a slow pipeline and never reach the delivery outcome.
Change failure rate and deployment rework rate are the pair worth watching, and they are the ones that turn early. Rework rate in particular is the leading indicator for AI-assisted work: code that was accepted quickly and then needed substantial revision shows up there before it shows up anywhere else. A team whose lead time improves while rework rate climbs has not gained anything; it has moved the cost later in the cycle, where it is more expensive.
Deployment frequency moves last, if it moves at all, because it is usually governed by release policy rather than by authoring speed. A team that deploys on a weekly cadence will keep deploying weekly no matter how fast the code gets written, so treating flat deployment frequency as evidence that AI is not helping is a misreading of what the metric is constrained by.
You cannot measure an effect smaller than your noise floor
There is a precondition to all of this that gets skipped. The 2025 DORA Report on AI-Assisted Software Development finds that AI tools amplify a team's existing CI/CD practices rather than fixing them. Teams with trunk-based development, fast tests, and healthy stability get more from an assistant, because its feedback loop is fast and reliable. Teams with long pipelines, flaky tests, and rerun-as-policy culture get less.
The amplification thesis has a measurement corollary that is rarely stated. If a pipeline is full of flaky tests, change failure rate is already noisy, because a meaningful share of failures are not caused by the change at all. Any effect AI assistance has on real failure rate is then buried underneath variance the team has not removed. The same applies to lead time when reruns are routine: the measurement is dominated by whether a test flipped, not by how the change was written.
So the first step in measuring AI coding productivity is not instrumenting the assistant. It is knowing which of your pipelines are healthy, which are flaky, and which are broken, and getting the flaky ones off the measurement path. Until then, the honest answer to whether the tools are helping is that the data cannot tell you.
Where CI/CD Watch fits
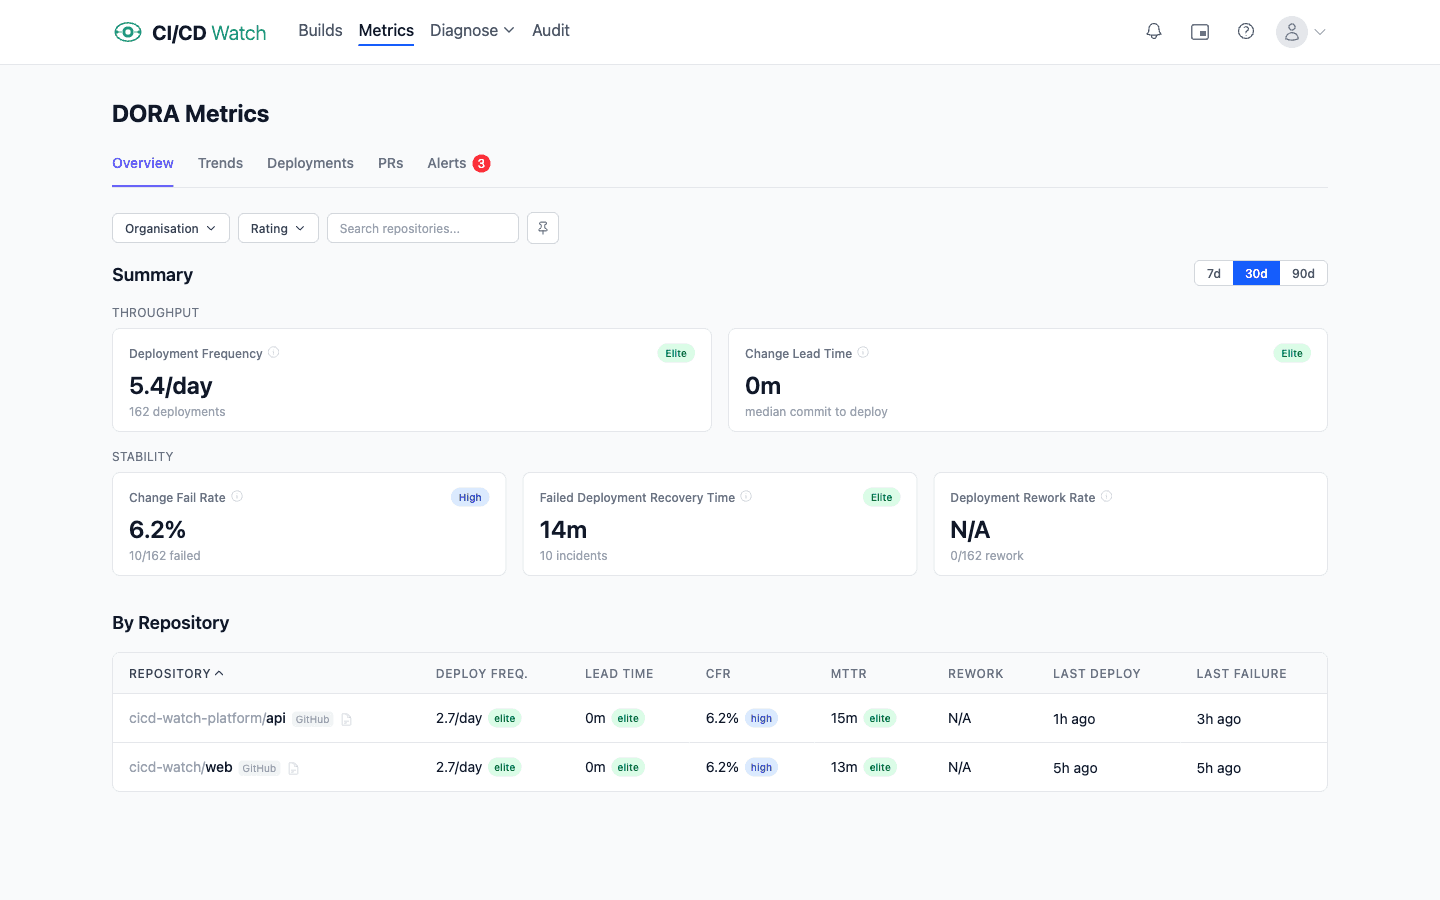
CI/CD Watch, a CI/CD observability platform that monitors pipelines across GitHub Actions, GitLab CI, Bitbucket Pipelines, CircleCI, Azure DevOps, and Jenkins, calculates the five DORA metrics from pipeline runs directly, which means the measurement does not depend on anyone tagging commits by authorship, and it classifies pipelines as healthy, flaky, or broken so the noise floor is visible before anyone reads a trend.
That combination is the useful one for this question. A team can see whether rework rate and change failure rate moved after adopting an assistant, and separately whether the pipelines those metrics come from are stable enough for the movement to mean anything. The platform surfaces the signals; the judgement about what to change stays with the team.
The same signals are readable by the assistants themselves through the MCP server, which is covered in the MCP context post and, per assistant, in CI/CD for Copilot, Cursor, and Claude Code. The signals to watch after a rollout, rather than the metrics to avoid, are set out in monitoring AI-generated code.
Start by baselining
The practical sequence is short. Establish the five metrics before or alongside a rollout rather than after it, because a baseline collected once the tools are already in use answers a different question. Take flaky pipelines off the measurement path so the numbers mean something. Then watch rework rate and change failure rate first, lead time second, and treat deployment frequency as constrained by release policy until proven otherwise.
None of that requires a new measurement framework, which is the point. If you want the baseline in place before the next procurement conversation, connect a provider on the Free tier and let a few weeks of pipeline history accumulate. The buyer-facing view of the same ground is on the AI-assisted development page.
CI/CD Watch is built by 3CS Technologies Ltd, a UK consultancy that has run pipeline audits across regulated programmes and now runs the same engine inside the SaaS platform. We hold the position that AI-assisted software development is measured by delivery outcomes because that is how we measure our own.