Search for monitoring AI-generated code and most of what comes back is detection software: tools that claim to tell you whether a human or a model wrote a given file. That is a different problem, and for a team that has deliberately rolled out Copilot or Cursor, it is not a useful one. You already know the code is AI-assisted. You approved it.
The useful question is what changed in your delivery signals after the rollout. Monitoring AI-generated code is an observability problem, not a forensics problem: the pipeline already emits everything needed to see whether the new drafting speed is turning into delivered software or into rework. The frame for why those signals are the right ones sits in the guide to AI-assisted software development; what follows is the specific set of signals to watch and what each shift means.
Why detection is the wrong instrument
Detection tools answer “was this written by a model?” That question has three problems in a team that has adopted assistants on purpose.
It has no action attached. If a file is flagged as AI-authored, nothing follows. You are not going to revert it for that reason alone, and if you would, the policy problem is upstream of the tooling.
The classification is unstable. Real work is mixed: drafted with an assistant, half rewritten, refactored on a suggestion, hand-edited in the tests. There is no honest label for that commit.
Most importantly, it measures the wrong layer. Whether a change was AI-assisted is a property of authorship. Whether it broke production is a property of the system, and the system is what you can actually improve.
Monitoring AI-generated code: the four signals worth watching
Four signals shift in recognisable ways when a team's drafting speed increases. None of them require knowing which lines came from an assistant.
1. Change volume per review
The first thing that moves after an assistant rollout is usually the size of the average change. Drafting got cheaper, so changes get bigger. That matters because review capacity did not change: the same humans read the same number of hours per week. A rising volume-per-review with flat review throughput is the earliest observable sign that the bottleneck has moved downstream from authoring into review.
This is a signal to act on rather than a problem in itself. The usual fix is smaller changes rather than faster reviewers, which is the same answer trunk-based development gives for reasons that predate AI entirely.
2. Rerun rate
Rerun rate is the cheapest early-warning signal a pipeline emits. If it climbs after a rollout, one of two things is happening: the new changes are genuinely failing more often, or they are landing on tests that were already flaky and the increased change volume is simply sampling that flakiness more frequently.
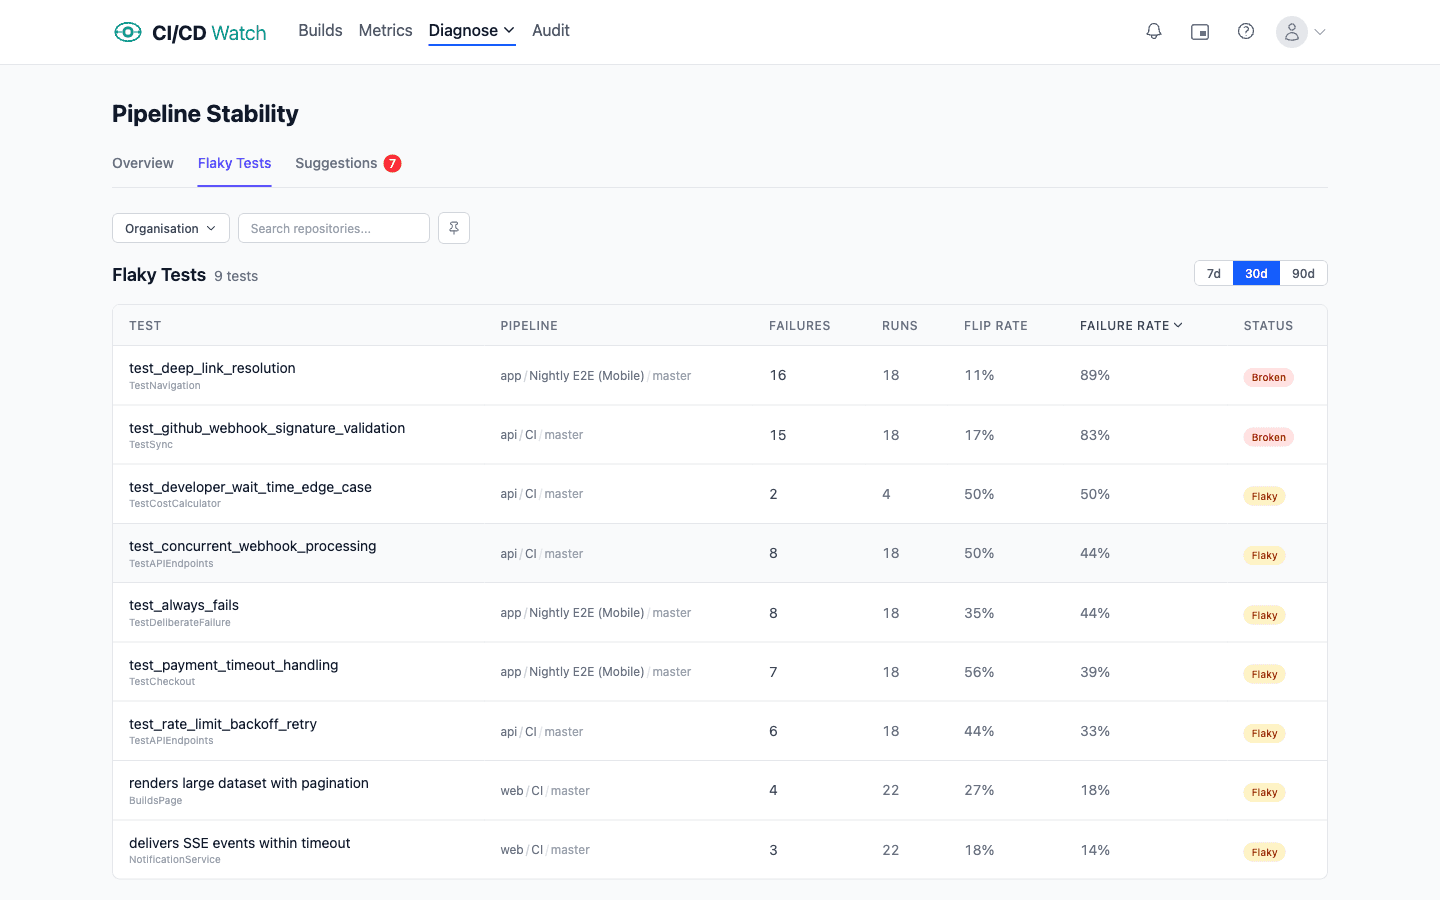
Those two causes need opposite responses, and telling them apart requires per-test history rather than a pipeline-level pass rate. How that history is derived from test reports is in the flaky-test detection docs. If the reruns concentrate on tests that were already classified flaky, the assistant is not the cause; the flakiness was there and you are now hitting it more often. The cost of that is covered in the flaky test cost breakdown.
3. Change failure rate
Change failure rate is the signal that answers the question leadership is actually asking. It describes what happens when the team's changes reach production, and it moves for real reasons rather than for measurement artefacts, provided the pipeline underneath it is stable enough to be trusted.
Read it against deployment frequency rather than alone. More changes shipping with a steady failure rate is the outcome a rollout is meant to produce. More changes shipping with a rising failure rate means throughput was bought with stability, which is a trade the team should make deliberately rather than discover in a quarterly review.
4. Deployment rework rate
Rework rate is the one most teams are not watching and the one that turns earliest for AI-assisted work. Code that was accepted quickly and then needed substantial revision shows up here before it shows up in change failure rate, because rework is what happens to changes that were plausible rather than correct.
A rollout that improves drafting speed while raising rework rate has not saved the team anything. It has moved effort from the authoring step, which is cheap, into the revision step, which is expensive because it carries review and pipeline cost with it every time.
What none of these tell you
Being clear about the limits keeps the signals honest. None of these four attribute an outcome to the assistant. They describe the team's delivery system before and after a change in how the team works, and a rollout is rarely the only thing that changed in a quarter.
They also cannot tell you whether the code is well designed. Maintainability shows up in these numbers eventually, through rework and through review load, but slowly and mixed with everything else. Anyone promising a real-time quality score for AI-generated code is selling the same activity-metric mistake described in measuring AI coding productivity with a different label.
The precondition nobody mentions
Every signal above assumes the pipeline underneath is stable enough to read. If a meaningful share of your failures are flaky rather than real, change failure rate is already noise, and no amount of watching it after a rollout will separate the assistant's effect from the variance that was there before.
This is the amplification thesis applied to measurement. The 2025 DORA Report on AI-Assisted Software Development finds that AI tools amplify a team's existing CI/CD practices rather than fixing them, and that cuts both ways: a team that cannot currently tell a flaky failure from a real one will not be able to tell an AI-caused regression from either. Classifying pipelines as healthy, flaky, or broken is prerequisite work, not a later refinement.
Where CI/CD Watch fits
CI/CD Watch, a CI/CD observability platform that monitors pipelines across GitHub Actions, GitLab CI, Bitbucket Pipelines, CircleCI, Azure DevOps, and Jenkins, derives the four signals above from pipeline runs and test reports directly, which means none of them depend on tagging commits by authorship, and it classifies pipelines and individual tests as healthy, flaky, or broken so the difference between a real regression and existing noise is visible rather than assumed.
The platform surfaces the shift; deciding whether smaller changes, better tests, or a different review policy is the answer stays with the team. That division is deliberate. A tool that claimed to fix review load automatically would be making the same category error as a tool that claims to score AI code quality.
Where to start
Take a baseline before the rollout widens if you still can, or as early as possible if it has already happened. Classify the pipelines first so the noise floor is known. Then watch rework rate and rerun rate weekly and change failure rate monthly, because the first two turn quickly and the third needs enough deployments to mean anything.
If you want those signals in place before the next rollout conversation, connect a provider on the Free tier and let a few weeks of history accumulate. Test-level stability detail and cost analysis sit on the paid tiers; pipeline monitoring and the run history the baseline needs do not.
CI/CD Watch is built by 3CS Technologies Ltd, a UK consultancy that has run pipeline audits across regulated programmes and now runs the same engine inside the SaaS platform. We treat AI-assisted software development as a consumer of existing delivery signals rather than a reason to invent new ones.