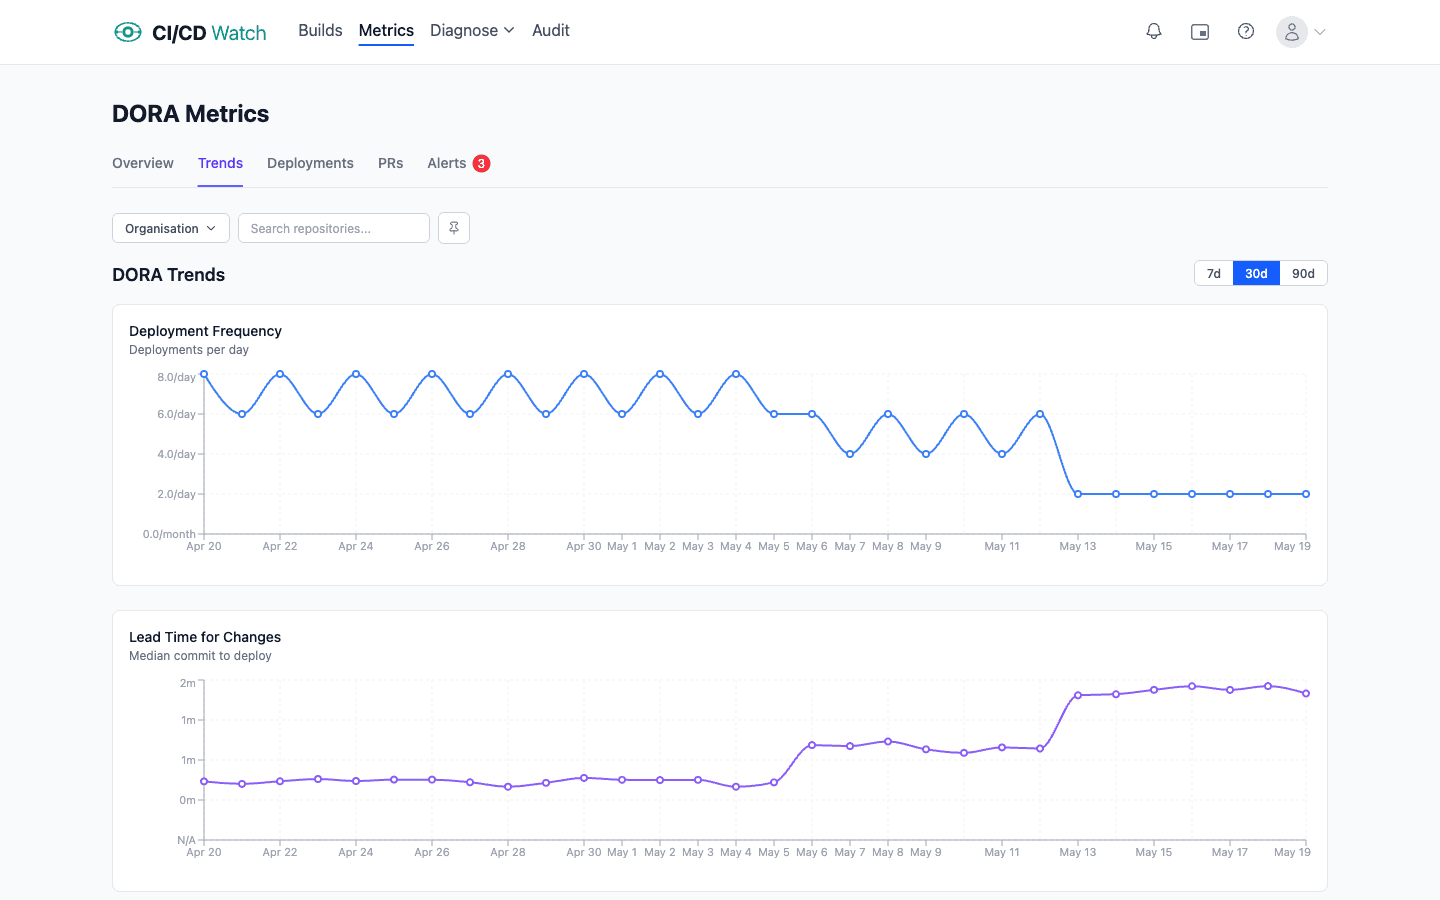
A team ships forty times a week and says so proudly in every stand-up. The deployment frequency chart is a wall of green. Then someone counts how many of those deploys were hotfixes for the deploy before, and the mood changes. Nearly one in three. The team is not shipping forty changes a week. It is shipping somewhere around thirty, and patching ten of them in production.
Change failure rate (DORA's current shorthand is change fail rate) is the metric that exposes that gap. It is the percentage of deployments that cause a failure in production: a rollback, a hotfix, or a degraded service. Unlike the throughput metrics, you cannot improve it by working harder or shipping faster. It moves only when the quality of what you ship changes. That makes it the most honest stability signal you have, and the only way to fake it is to quietly redefine what counts as a failure.
Change failure rate is one of the five DORA metrics: the two throughput metrics (deployment frequency and change lead time) plus three stability metrics (change fail rate, failed deployment recovery time, and deployment rework rate, added in the 2024 DORA Report). What follows is the stability metric most teams measure first: what it actually counts, why speed cannot move it, the one way it gets gamed, and how to bring it down without slowing the team to a crawl.
What change failure rate actually measures
The definition is a simple ratio: of the deployments that reached production over some window, what fraction caused a failure that needed an unplanned response. For example, if you deployed 100 times last month and 8 of those needed a rollback, a hotfix, or caused a degraded service, your change failure rate is 8%. The numerator is failed deployments, the denominator is all deployments, and the window is whatever period you are reporting on.
The 2024 DORA Report places teams into four bands on this metric: 0 to 5% for Elite, 5 to 10% for High, 10 to 15% for Medium, and above 15% for Low. As with every DORA band, the gaps between tiers matter more than movement within one. A team at 6% versus 8% is not meaningfully different. A team at 6% versus 22% absolutely is, and the second team is spending a large share of its deployment capacity cleaning up after itself.
One thing the ratio does not measure is severity. A cosmetic CSS regression and a checkout outage both count as one failed deployment. Change failure rate is a frequency signal, not an impact signal. The impact lives in how you measure DORA metrics end to end, alongside recovery time, which is where the cost of each failure actually shows up.
Why you can't fake it by going faster
The throughput metrics all have a speed lever. Deployment frequency goes up if you split one feature across five releases or start counting config pushes as deploys. Lead time falls if reviews get rubber-stamped or staging gets skipped. In both cases the number improves while nothing real changes, because the metric measures an activity and you can manufacture more of the activity.
Change failure rate has no equivalent lever, because it is a ratio of bad outcomes to total outcomes. Shipping more does not help: every extra deploy lands in the denominator and, if your quality has not changed, brings its share of failures into the numerator with it. Working longer hours does not help either. The only way the ratio falls is if a smaller proportion of what you ship breaks production, which means the underlying quality of changes has genuinely improved. That is the sense in which it cannot be faked: you cannot out-effort it and you cannot out-speed it.
The one way it does get gamed: definitional drift
There is exactly one gaming vector, and it is the same one that catches every DORA metric used as a target: the definition quietly narrows. Last quarter a hotfix within 24 hours counted as a change failure. This quarter it gets reclassified as a planned follow-up. An incident that would have been logged against a release gets recorded as not deploy-related. The production environment gets redefined so a class of deploys no longer counts. The number drops, and production is no more reliable than it was.
This is Goodhart's Law in its purest form: the moment change failure rate becomes an OKR a team is graded on, the incentive shifts from reducing failures to reducing the things that get counted as failures. The defence is not a cleverer metric. It is keeping the classification rules in one visible place and applying them uniformly over time, so that drift becomes obvious instead of invisible. Track the metric as a team-level diagnostic, never as an individual performance target.
What counts as a change failure
Pinning the definition is the work. Three signals are defensible and reproducible, in roughly descending order of clarity:
- A rollback. The clearest signal there is. A deployment that was reverted because it broke something is unambiguously a change failure. If your deploy tooling records rollbacks, this is the cheapest place to start.
- A hotfix shortly after a deploy. A fix-forward release within a short window (24 hours is a common rule) is a strong signal that the previous deploy was broken. Set the window, document it, and do not move it to flatter the chart.
- An incident linked to a release. An incident declared in an on-call or status system and attributed to a specific deploy. This catches degraded-service failures that never triggered a rollback but still hurt users.
The denominator needs the same care. Change failure rate is a ratio of failed deployments to all deployments, so a wobbly definition of "deployment" corrupts both halves at once. A successful build is not a deployment. A push to staging is not a deployment in DORA terms. The cleanest approach is to declare a deployment rule per service (a tag push, a manual promotion through a gate, a named workflow reaching a customer-facing environment) and apply it consistently, rather than assuming every workflow run ships to production.
Change failure rate vs deployment rework rate
The 2024 DORA Report added deployment rework rate as a third stability metric, and the two are easy to confuse. Change failure rate counts the deploys that needed an immediate, unplanned response. Deployment rework rate counts the follow-up deploys those failures generate. A team can have a low change failure rate and a high rework rate, which tells a specific story: failures are rare, but when one happens the team recovers with a string of catch-up releases rather than a single clean fix.
Read together with failed deployment recovery time, the stability trio answers three different questions: how often you break production, how long the breakage lasts, and how much follow-up work each break creates. A low change failure rate alone is not proof of a healthy deploy loop; it is one of three readings you need.
How to actually bring it down
Because change failure rate is an outcome, not an activity, you lower it by changing the practices that determine quality, not by telling people to be more careful. The DORA research is consistent on this point: the teams with the lowest change failure rates are also the ones that deploy most often, because the same practices improve both at once.
- Smaller batches. A deploy that changes three files fails in ways you can reason about. A deploy that changes ninety fails in ways nobody predicted. Small batches are the single biggest lever on failure rate.
- Test automation you trust. A failure rate problem is often a test problem in disguise. If the suite is flaky, people learn to ignore red, and real regressions ship behind the noise. Fix the signal before trusting the gate.
- Progressive delivery. Canary releases and staged rollouts mean a bad change reaches a small slice of traffic first, so a failure is caught before it becomes a full-fleet incident. The deploy still failed; far fewer users saw it.
- Feature flags. Decoupling deploy from release lets you ship code dark and turn it on gradually. A problem found behind a flag is a config toggle, not a rollback, and the change that carried it never counts against your failure rate.
How CI/CD Watch surfaces change failure rate
CI/CD Watch, a CI/CD observability platform that monitors pipelines across GitHub Actions, GitLab CI, Bitbucket Pipelines, CircleCI, Azure DevOps, and Jenkins, derives change failure rate from the same deployment rules that drive the other DORA metrics. A deployment is whatever a service's rule says it is, and a failure is detected from rollback signals, fix-forward windows, and incidents attributed to a release, with the classification held in one place rather than drifting per team. How each rule is evaluated is set out in the DORA metrics reference.
Change failure rate trends and the Elite / High / Medium / Low band each repository falls into sit on the Team plan and above. The Free tier covers pipeline-run monitoring, which is enough to confirm the upstream signals (run outcomes, deployment cadence, rerun volume) are coherent before layering stability analysis on top.
See your change failure rate across providers
CI/CD Watch's Free tier covers pipeline-run monitoring for small teams. Connect a provider to see deployment outcomes and cadence across your workflows, the upstream signals the failure-rate calculation depends on. Change failure rate trends and the performance banding live on the Team plan and above. For the broader framework this metric sits inside, the DORA metrics overview covers all five.
CI/CD Watch is built by 3CS Technologies Ltd. It started as an internal tool for tracking pipeline health across a mixed GitHub Actions and Jenkins estate. The same engine now powers the SaaS platform.