In application infrastructure the monitoring and observability distinction has been argued to exhaustion, usually settling on known-unknowns versus unknown-unknowns. CI/CD monitoring vs observability is a more useful split than it sounds, because the two answer different questions and most teams only have the first one covered.
CI/CD monitoring answers is it broken right now. CI/CD observability answers why does this keep happening and what breaks next. The first is a property of a single run. The second only exists across many runs, which is why a provider dashboard can deliver one and structurally cannot deliver the other. The underlying feedback-loop argument is in the guide to CI/CD monitoring.
CI/CD monitoring vs observability: the single-run boundary
The cleanest way to separate the two is to ask how many runs you need to answer the question.
Did this build pass. Which step failed. How long did it take. Who triggered it. Every one of these is answerable from a single run record, and every CI provider shows them well. This is monitoring, and it is a solved problem that needs no additional product.
Is this test flaky or genuinely broken. Is the suite getting slower. Does this failure cluster with a particular runner or time of day. Which failures precede a fixing commit and which are ignored. None of these are answerable from one run at any level of detail, because they are all statements about a distribution. This is observability, and no amount of improving the single-run view produces it.
Why provider dashboards stop at the boundary
This is not a criticism of provider tooling. A CI provider is built to execute a run and report on it, and it does that accurately. The gap is architectural rather than a missing feature.
Run history is retained for a bounded window, which caps how far back a trend can reach. The view is scoped to one repository, so patterns that span repositories are invisible. Test results are artefacts attached to a run rather than entities with a history, so no per-test flip rate can exist. And the estate is per-provider, so a team on more than one provider has no view that spans them. The build-or-buy version of this argument is set out in CI/CD dashboard vs provider UI.
What CI/CD observability actually consists of
Borrowing traces and spans from application observability does not transfer well, because a pipeline is not a request. Four capabilities do the work instead.
Per-test history across runs. Treating each test as an entity with a record rather than as a line in a report. This is what makes flip rate computable, and flip rate is what separates a flaky test from a broken one.
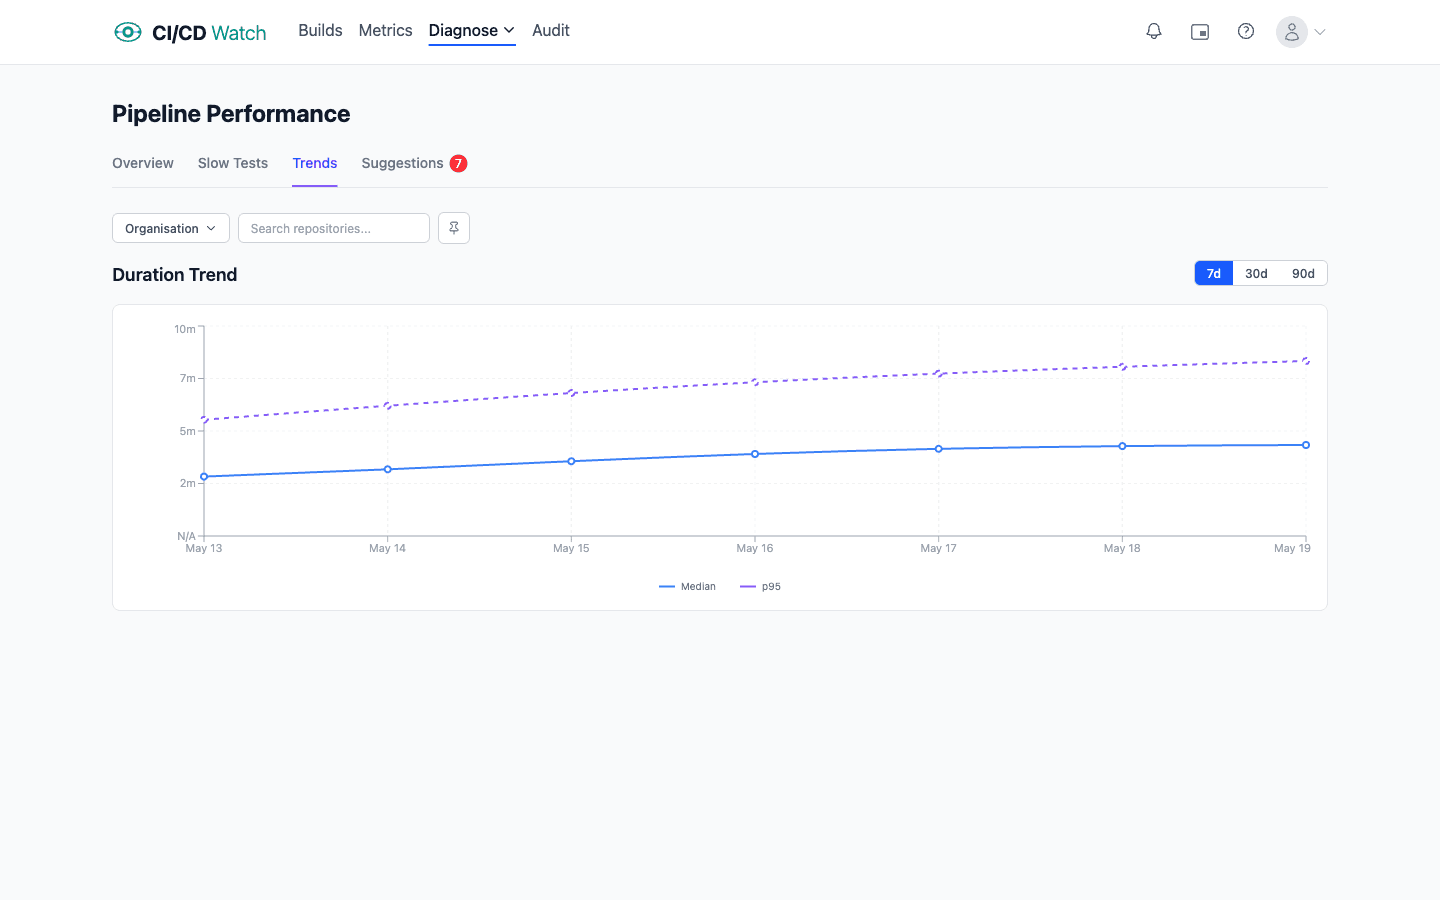
Duration distributions rather than durations. A median hides the tail that people actually feel. Watching p95 against median tells you whether the pipeline is uniformly slow or occasionally terrible, and those have different fixes. How the bands are computed is in the performance-ratings docs.
Failure clustering. Grouping failures by runner, branch, time, and change author surfaces causes that are invisible per run. A job that only fails on one runner image is an environment problem wearing a test-failure costume.
Cross-run causal chains. Which failures were followed by a fixing commit, which were followed by a rerun, and which were followed by nothing at all. The third category is the interesting one: it identifies signals nobody reads, which is both waste and a slow-burning risk.
Why the distinction is worth making
It is not terminology for its own sake. Teams that conflate the two buy the wrong thing and then conclude the category does not work.
The common version: a team is frustrated by flaky tests, so it buys a status dashboard. The dashboard shows current state beautifully and answers none of the questions the team actually had, because every one of them was a cross-run question. The conclusion drawn is that pipeline tooling does not help, when the tool bought was solving the problem the provider had already solved.
The reverse error is rarer and cheaper: buying analytics when the actual need was an alert on a red trunk. Whether trunk health needs speed and everything else needs correctness is covered in what real-time CI/CD monitoring actually means.
Building the cross-run layer yourself
The cross-run layer is buildable, and plenty of platform teams have built it: pull the runs API on a schedule, land the results in a warehouse, put a BI tool on top. It is a reasonable choice, and it is worth being clear about what the work actually consists of rather than treating build-versus-buy as a matter of taste.
The ingestion is the easy part and the part everyone estimates. The parts that consume the time are the ones that only appear after a few months. Test results arrive as report files whose format varies by framework, and parsing them into per-test entities means handling aggregation across matrix jobs, runners that mark skipped tests as passed, and renames that break a test's history. Rate-limit budgets have to be respected per provider. Backfill has to run when a connection is added, and reconciliation when a poll is missed. Each is tractable; together they are a service with an owner rather than a script.
The honest version of the decision: building it is right when the team has questions specific enough that no product answers them, and wrong when the goal is the standard set of cross-run questions everybody has. The second case is where teams end up maintaining a data pipeline that is not their product.
You still need both
Observability does not replace monitoring. Somebody still needs to know that main is red within a minute, and that is a single-run question. The relationship is that monitoring tells you to look and observability tells you what you are looking at, and a team with only the first spends its time reacting to events it cannot explain.
The practical sequence is to keep the provider view for monitoring, since it is already good and already paid for, and add the cross-run layer separately. What belongs in that layer is set out in what to monitor in CI/CD.
Where CI/CD Watch fits
CI/CD Watch, a CI/CD observability platform that monitors pipelines across GitHub Actions, GitLab CI, Bitbucket Pipelines, CircleCI, Azure DevOps, and Jenkins, sits on the observability side of the line: retaining run and test history beyond the provider window, treating each test as an entity with a flip rate, computing duration distributions rather than averages, and normalising all of it across providers so a mixed estate has one view.
It is not a replacement for the provider dashboard and does not try to be. The provider is better at telling you what is happening in the run executing right now, because it is the thing executing it.
Sort your questions first
Write down the five questions about your pipelines you most want answered, then mark each one as single-run or cross-run. If most are cross-run and you only have a provider dashboard, the gap is now specific rather than a vague sense that CI is painful.
To see which of your cross-run questions have answers, connect a provider on the Free tier. History needs a few weeks to accumulate before the distributions mean anything, so starting earlier is better than starting when the question becomes urgent.
CI/CD Watch is built by 3CS Technologies Ltd, a UK consultancy that has run pipeline audits across regulated programmes and now runs the same engine inside the SaaS platform. The cross-run layer is the part of CI/CD monitoring that no single provider can give a team on more than one provider.