Real-time is the most abused word in monitoring. On a vendor page it can mean a dashboard that refreshes every thirty seconds, a poller hammering an API once a minute, or an event stream that pushes within a second of something happening. Three different architectures, three different cost profiles, one word.
For CI/CD specifically the distinction matters more than usual, because the providers you are monitoring impose rate limits and will throttle you for guessing wrong. Real-time CI/CD monitoring is best understood as a spectrum of freshness mechanisms with different costs, not as a binary a product either has or lacks. The wider argument for why pipeline feedback speed matters at all is in the guide to CI/CD monitoring.
The three mechanisms behind real-time CI/CD monitoring
Almost every product claiming real-time pipeline status uses one of three approaches underneath.
Fixed-interval polling
Ask the provider for the run list every N seconds regardless of whether anything changed. Simple, and it scales badly in exactly the way you would expect. Every poll spends a rate-limit unit whether or not there is news, so the interval you can afford falls as the number of repositories you watch rises. A team monitoring five repositories can poll often. The same architecture across two hundred repositories either slows to a crawl or gets throttled.
The freshness this gives you is bounded by the interval, and the interval is bounded by your rate-limit budget divided by the number of things you watch. That is the whole trade.
Conditional polling with ETags
Ask the provider the same question but include the entity tag from the previous response in an If-None-Match header. If nothing changed, the provider answers 304 Not Modified with no body. On the major providers a 304 is substantially cheaper against the rate limit than a full response, and on some it is free, which changes the arithmetic completely: you can ask far more often because asking costs almost nothing when the answer is no.
This is the mechanism CI/CD Watch uses. It is also why we do not cache repository listings on a timer. A cache with a time-to-live trades freshness for load, and conditional requests let you keep the freshness and drop the load instead. The cost is bookkeeping: an ETag per resource per connection, stored and sent back on the next request. What we store and how often it refreshes is documented in the data and sync docs.
Event push
The provider tells you when something happens rather than waiting to be asked. Latency is the best of the three, and the costs are different in kind rather than smaller: an internet-facing endpoint to receive events, signature verification, replay and deduplication handling, and a reconciliation path for the events that get missed during an outage. Push alone is never sufficient, because a missed event is invisible until something reconciles against the provider.
That last point is the one most comparisons skip. Any product built purely on push needs a polling path anyway to catch what push dropped, which means the interesting question is not push versus poll but how cheap your polling is.
What freshness you actually need
Sub-second pipeline status sounds appealing and is rarely worth paying for. The useful question is what decision the freshness supports, and pipeline decisions divide into three bands.
Did my build pass? The developer who just pushed wants to know within a minute or so. Below that, the pipeline itself takes minutes to run, so shaving detection latency from sixty seconds to five changes nothing about when they can act.
Is main broken right now? This one genuinely rewards speed, because the cost of a red trunk accrues per engineer per minute across everyone blocked from merging. Detection latency here is worth optimising, and it is the case that justifies alerting rather than dashboards.
Is our rerun rate trending up? Freshness is nearly irrelevant. This is a question about a window of days or weeks, and answering it with data that is an hour old is indistinguishable from answering it with data that is a second old.
Most of the value in pipeline monitoring sits in the third band, which is the opposite of where the marketing emphasis goes. The cross-run pattern work that makes monitoring worth doing is covered in what to monitor in CI/CD.
The multi-provider complication
Everything above gets harder once a team is on more than one provider, which most teams of any size are. The mechanisms are the same but the constraints are not shared, and freshness ends up governed by whichever provider is least generous.
Rate limits differ in unit and in scope. Some meter requests per hour, others per minute; some scope the budget to the installation, others to the user or the token. A polling schedule tuned for one will either waste headroom or blow through the limit on another. Conditional-request support differs too: the header semantics are standard, but which endpoints honour them, and how much a 304 costs against the budget, is provider-specific.
The practical consequence is that a single global polling interval is the wrong design. The budget has to be tracked per connection, and the schedule derived from it, otherwise the estate runs at the pace of its most constrained provider. This is unglamorous engineering, and it is most of what makes monitoring a mixed estate harder than monitoring one provider well.
It also explains a failure mode worth watching for in any product: silent staleness. When a provider throttles, the honest behaviour is to back off and show the data as stale. The common behaviour is to keep rendering the last successful response with no indication that it stopped updating, which is worse than an outage because the dashboard still looks correct.
Questions worth asking a vendor
Since real-time on its own means nothing, four questions establish what a product actually does. What is the mechanism: fixed polling, conditional requests, push, or a combination. What happens to freshness as repository count rises, which is where fixed-interval architectures degrade. What happens when the provider rate-limits you, and specifically whether the product backs off gracefully or silently goes stale. And if push is claimed, what reconciles the events that were missed.
A product that answers all four clearly is describing an architecture. A product that answers real-time is describing a marketing position.
Where CI/CD Watch fits
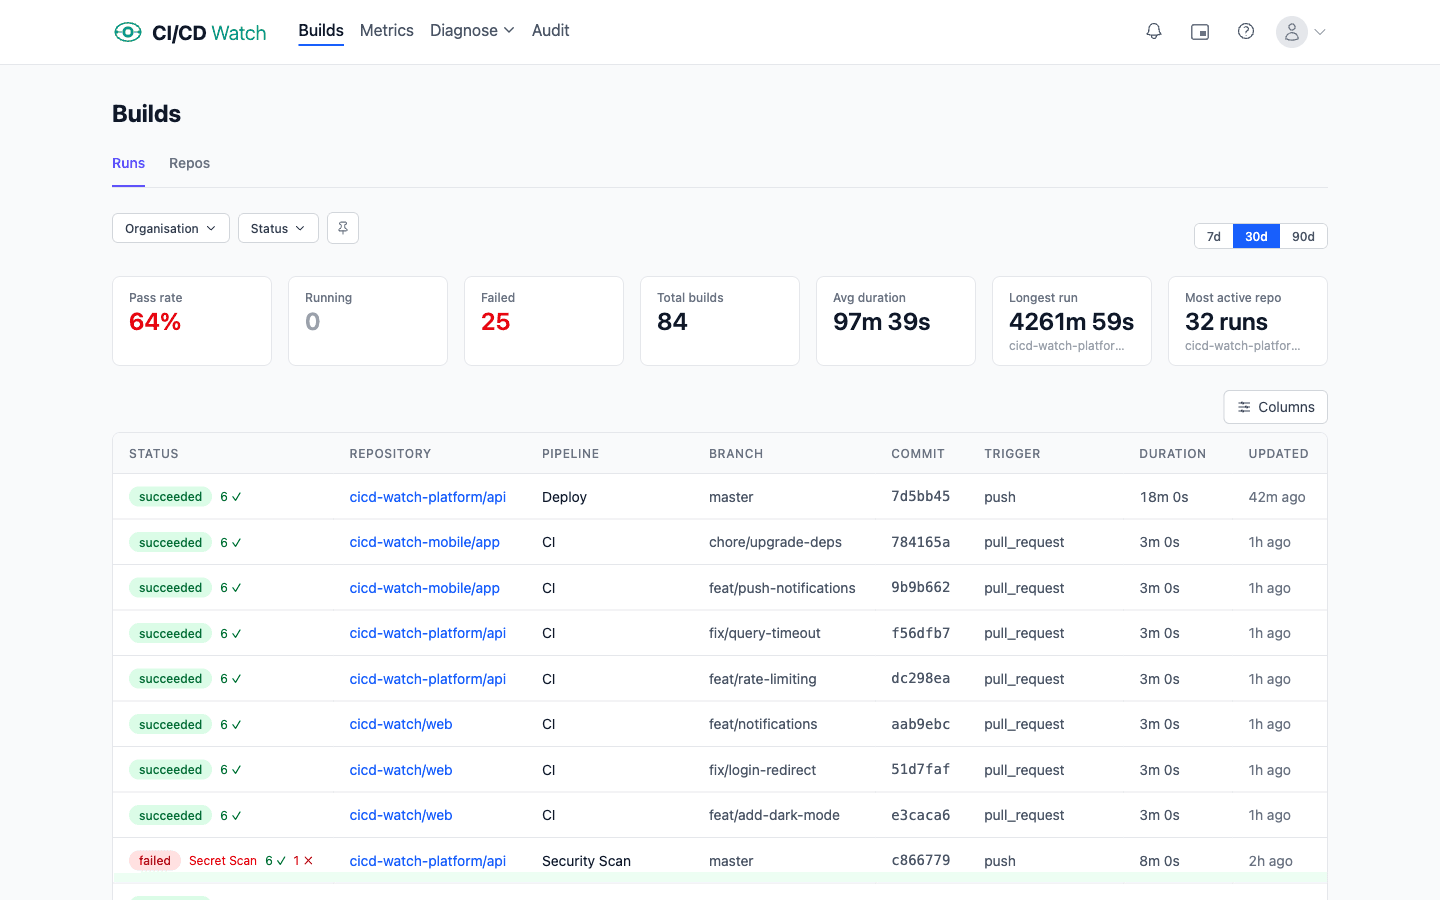
CI/CD Watch, a CI/CD observability platform that monitors pipelines across GitHub Actions, GitLab CI, Bitbucket Pipelines, CircleCI, Azure DevOps, and Jenkins, syncs through ETag-based conditional requests, which is the middle mechanism above, chosen deliberately so that freshness does not degrade as a tenant connects more repositories.
The trade we made is explicit: we ask the provider often and rely on 304 responses to keep that affordable, rather than stretching a polling interval or asking teams to configure inbound endpoints. Repository listings in particular are never served from a timed cache, because detecting that a repository appeared or disappeared is one of the things a team notices immediately when it is wrong.
Judge it on the decision
Pick the decision you need the data for, then ask what freshness that decision requires. For most teams the honest answer is that trunk health needs to be fast and everything else needs to be correct, which is a much easier requirement to satisfy than real-time and a much more useful one to specify.
If you want to see what the conditional-request approach feels like against your own repositories, connect a provider on the Free tier. Pipeline monitoring and run history are on Free; the analytical views that answer the third-band questions sit on the paid tiers.
CI/CD Watch is built by 3CS Technologies Ltd, a UK consultancy that has run pipeline audits across regulated programmes and now runs the same engine inside the SaaS platform. The rate-limit arithmetic in this post is the reason CI/CD monitoring across a mixed estate is harder than monitoring one provider well.