The incident review says the outage was resolved in twelve minutes. The dashboard agrees: deploy at 14:02, alert at 14:08, "resolved" at 14:20. Then a support lead points out that customers were getting 500s from 13:55, seven minutes before the deploy even finished rolling out, and that the checkout path stayed broken for a paying cohort until 15:10. The real recovery took over an hour. The twelve-minute number measured how fast engineering clicked resolve, not how fast the problem went away.
Failed deployment recovery time, still widely called mean time to recovery (MTTR), is the metric that gap belongs to. It measures how long it takes to restore service after a deployment causes a failure. The definition is not the hard part. The number is only honest if the clock starts when customers are affected and stops when the problem is actually fixed, not when someone declares it resolved.
Recovery time is one of the five DORA metrics, and one of the three stability metrics alongside change fail rate and deployment rework rate. Where change failure rate asks how often you break production, recovery time asks how long the breakage lasts. What follows is the stability metric that accepts failure as inevitable: what it measures, where the two clock decisions hide, and how to bring it down without relying on heroics.
What mean time to recovery (MTTR) measures
DORA now publishes this metric as failed deployment recovery time. The older name, mean time to recovery (MTTR), is still in wide colloquial use and refers to the same thing: when a deployment causes a failure in production, how long does it take to restore normal service. It is a measure of resilience, not prevention. A team can have a low change failure rate and a slow recovery time, which means failures are rare but painful when they land.
The 2024 DORA Report bands run from under one hour for Elite teams, to under one day for High, one day to one week for Medium, and over six months for Low. As with every DORA band, the gap between tiers is what matters: a team recovering in 40 minutes versus 55 minutes is in the same place, but a team at 40 minutes versus three days is running an entirely different operation. The faster band is not luck. It comes from the deploy being reversible and the team knowing immediately that something is wrong.
Where the clock starts: customer impact, not engineering awareness
The clock-start decision is the one that determines whether recovery time describes the customer's experience or engineering's. The honest start point is when customers are affected, not when someone in engineering notices. Those two moments can sit an hour apart, and the gap between them is itself a signal: a long detection delay means your monitoring is not watching what users actually feel.
In practice this means hooking the clock into monitoring and status-page data, not just deployment logs. A deploy log tells you when the bad change shipped. It does not tell you when error rates climbed, when the first customer hit a broken checkout, or when latency crossed the threshold that matters. Starting the clock at "engineering paged" flatters the number by excluding the detection gap, which is often the most fixable part of the whole incident.
Where the clock stops: restored, not "resolved"
The clock-stop is where recovery time gets gamed, and it is the same Goodhart trap that catches every DORA metric used as a target. The clock should stop when service is genuinely restored for the affected users. It frequently stops earlier than that: an incident gets declared resolved before it actually is, a broken feature gets flag-disabled and called fixed, the dashboard goes green while a cohort of customers still sees the problem.
Rolling forward with a broken feature behind a disabled flag is a legitimate mitigation, but it is not the same as fixing the underlying problem, and treating it as a stop event teaches the team to optimise for the appearance of recovery. The defence is the same as for the other stability metrics: keep the resolution criteria in one visible place, apply them consistently, and treat recovery time as a team-level diagnostic rather than a number anyone is graded on. The moment it becomes an OKR, the incentive to declare resolution early overtakes the incentive to actually restore service.
Recovery time, change failure rate, and rework rate
The three stability metrics answer three different questions and only make sense read together. Change failure rate is how often a deploy breaks production. Recovery time is how long each break lasts. Deployment rework rate is how much follow-up deployment work each break generates. A team with a low failure rate but a slow recovery time has rare incidents that hurt; a team with a fast recovery time but a high rework rate recovers quickly each time but keeps having to come back. The practical decisions behind measuring all three are covered in how to measure DORA metrics.
How to actually bring recovery time down
Recovery time falls when failures become reversible and detectable, not when people try harder during incidents. This is the heart of site reliability engineering (SRE): treat failure as a normal operating condition and design the system so recovery is fast and undramatic rather than heroic. The DORA research is consistent: the teams that recover fastest are the ones that deploy often, because the same practices make both possible. The levers are deploy-safety practices, in roughly the order they pay off:
- Monitoring tied to customer impact. You cannot recover from what you cannot see. Alerts on user-facing signals (error rate, latency, checkout success) close the detection gap that dominates slow recoveries.
- Automated rollback. A one-command or automatic revert to the last good deploy turns recovery from a debugging session into a button press. The fastest recovery is undoing the change, not diagnosing it live.
- Safe deployment mechanics. Rolling updates and blue/green deployments keep a known-good version serving while the new one comes up, so recovery is an instant cutover back rather than a rebuild. Readiness probes gate traffic on health, holding a bad deploy out of rotation before it reaches the whole fleet.
- Feature-flag kill switches. Shipping risky changes behind a flag means recovery is a toggle, scoped to the one feature, with no redeploy. Decoupling deploy from release pays off twice: fewer failures and faster recovery.
- Small batches. When a deploy changes three files, diagnosis is fast because the suspect list is short. A large batch turns every incident into a hunt, and the hunt is where recovery time goes.
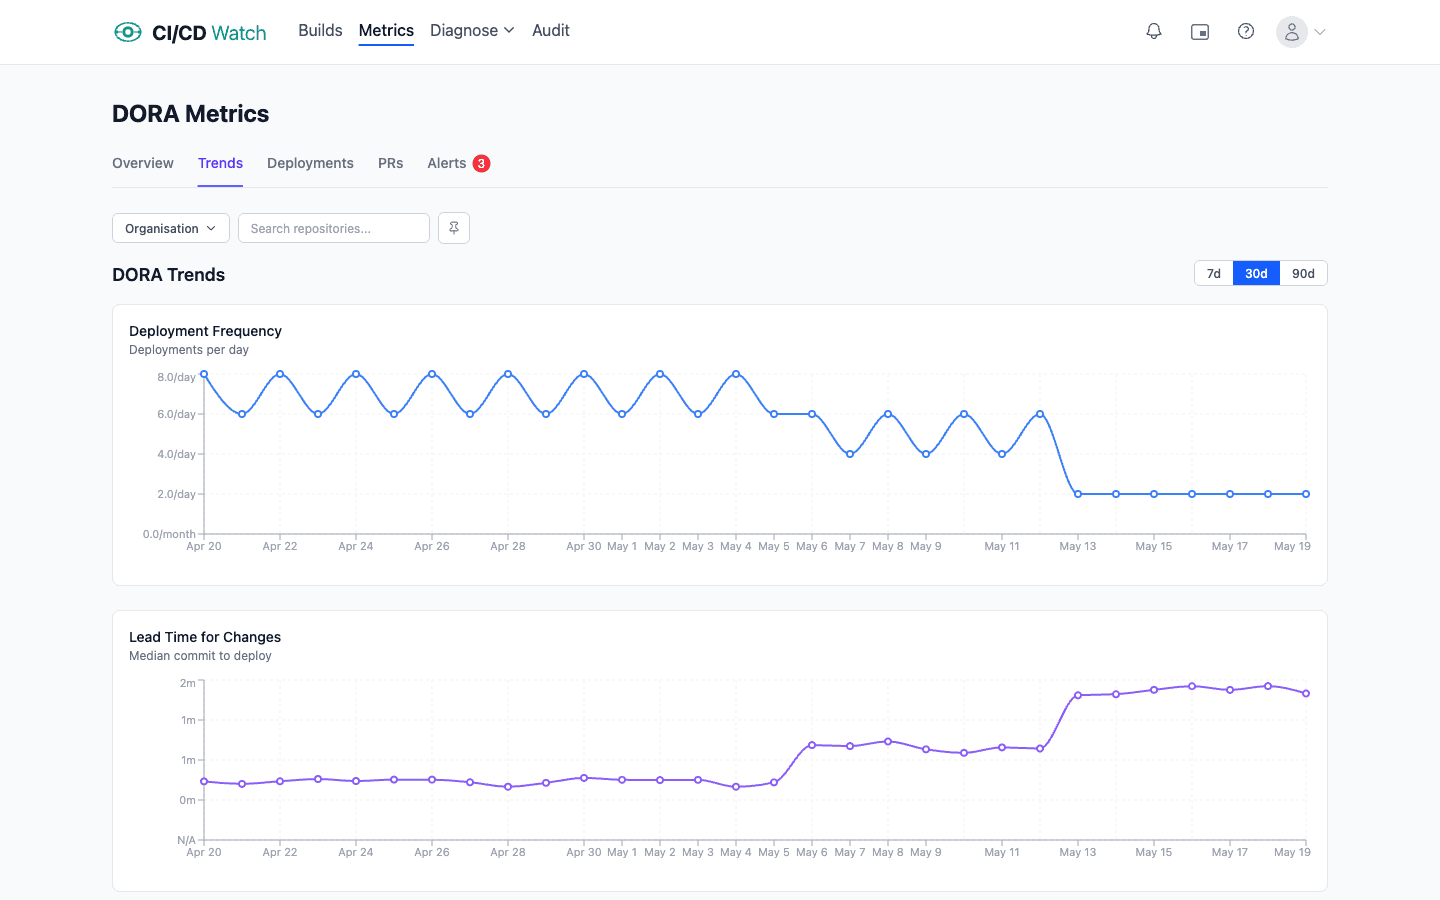
How CI/CD Watch surfaces recovery time
CI/CD Watch, a CI/CD observability platform that monitors pipelines across GitHub Actions, GitLab CI, Bitbucket Pipelines, CircleCI, Azure DevOps, and Jenkins, derives failed deployment recovery time from the same per-service deployment rules that drive the other DORA metrics: the interval between a deployment detected as failed and the subsequent deployment that restores the service. Anchoring the clock to genuine customer-impact windows depends on incident or status signals the pipeline alone does not carry, so recovery time is most accurate when those sources are connected. How each rule is evaluated is set out in the DORA metrics reference.
Recovery-time trends and the Elite / High / Medium / Low band each repository falls into sit on the Team plan and above. The Free tier covers pipeline-run monitoring, which is enough to confirm the upstream signals (deploy outcomes, rerun volume, deployment cadence) are coherent before layering stability analysis on top.
See your recovery time across providers
CI/CD Watch's Free tier covers pipeline-run monitoring for small teams. Connect a provider to see deploy outcomes and cadence across your workflows, the upstream signals the recovery-time calculation depends on. Recovery-time trends and the performance banding live on the Team plan and above. For the broader framework this metric sits inside, the DORA metrics overview covers all five.
CI/CD Watch is built by 3CS Technologies Ltd. It started as an internal tool for tracking pipeline health across a mixed GitHub Actions and Jenkins estate. The same engine now powers the SaaS platform.