Flaky Tests
CI/CD Watch parses JUnit XML test reports to track individual test case stability over time. This lets you identify which specific tests are flaky, how often they fail, and how much they're costing you in wasted pipeline runs.
How Test Results Are Collected
CI providers supply JUnit XML files from pipeline artifacts. CI/CD Watch supports both <testsuites> and <testsuite> as the root element.
Each test case's status is derived from its child elements:
| Child Element | Status |
|---|---|
<failure> | Failed |
<error> | Error |
<skipped> | Skipped |
| None | Passed |
Test Classification
Tests are classified using the same thresholds as pipeline stability:
| Classification | Criteria |
|---|---|
| Broken | Failure rate ≥ 80% |
| Flaky | Flip rate ≥ 30% andfailure rate > 0% |
| Healthy | Everything else |
Sorting Priority
Broken tests are shown first as the most urgent issues to address, followed by flaky tests, then healthy tests. This is the opposite of pipeline stability where flaky pipelines are shown first, for tests, a consistently broken test is typically a higher priority since it blocks every run it appears in.
Failure Details
CI/CD Watch captures the last failure message and stack trace for each test case. This helps you debug failures without having to dig through CI logs, you can see the error message and stack trace directly alongside the test's stability metrics.
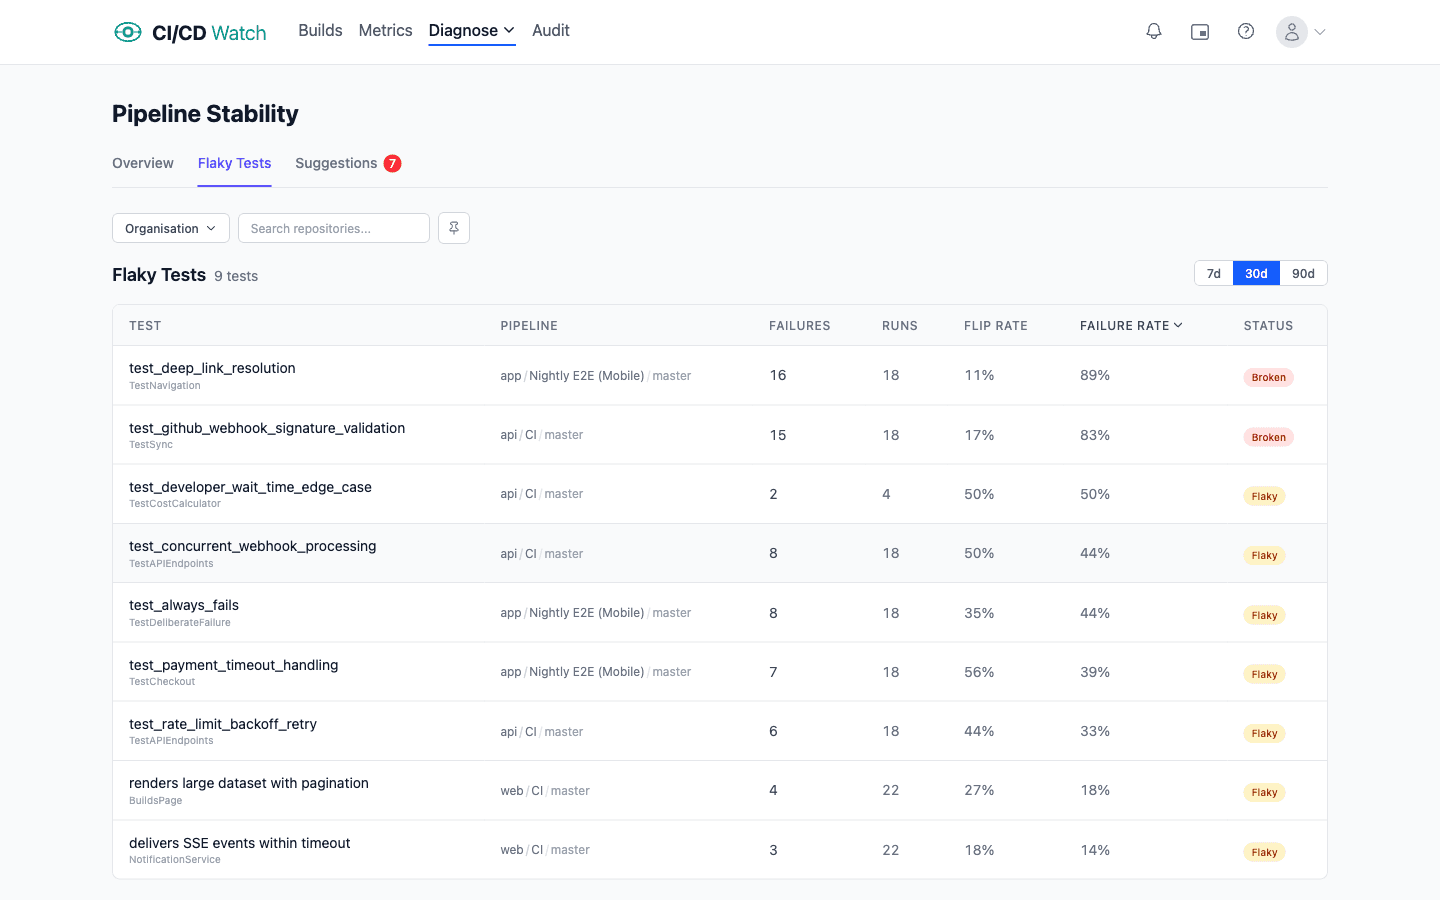
Flaky Tests Table
The dedicated flaky tests page (under Stability → Flaky Tests) presents all flaky and broken tests in a sortable table. Each row shows the test name, pipeline, failure count, total runs, flip rate, failure rate, and classification status.
Sort by any column to find the worst offenders, for example, sort by failure rate descending to see the most consistently failing tests first. The table supports 7, 30, and 90-day time windows and uses server-side sorting for fast page loads.
Waste Impact
Each flaky or broken test contributes to wasted pipeline runs. When a test fails intermittently, developers either rerun the entire pipeline or learn to ignore failures , both outcomes are costly.
The flaky tests page shows the estimated cost per test, combining compute charges and developer wait time from the pipeline runs affected by each test's failures. This helps you prioritize which tests to fix based on their real financial impact rather than just their failure rate. See cost calculations for details on how costs are estimated.
Related
- Pipeline Stability , how flaky tests affect pipeline-level stability classifications
- PR Health , the impact of test failures on pull request workflows
- Cost Calculations , how waste from flaky reruns is estimated
- Performance Ratings , how slow tests affect pipeline performance