Data view
The data view is a sortable per-repository overview of the raw data CI/CD Watch has ingested for your tenant. It answers two practical questions: which repositories do we have data on, and how recent is the data for repository X.
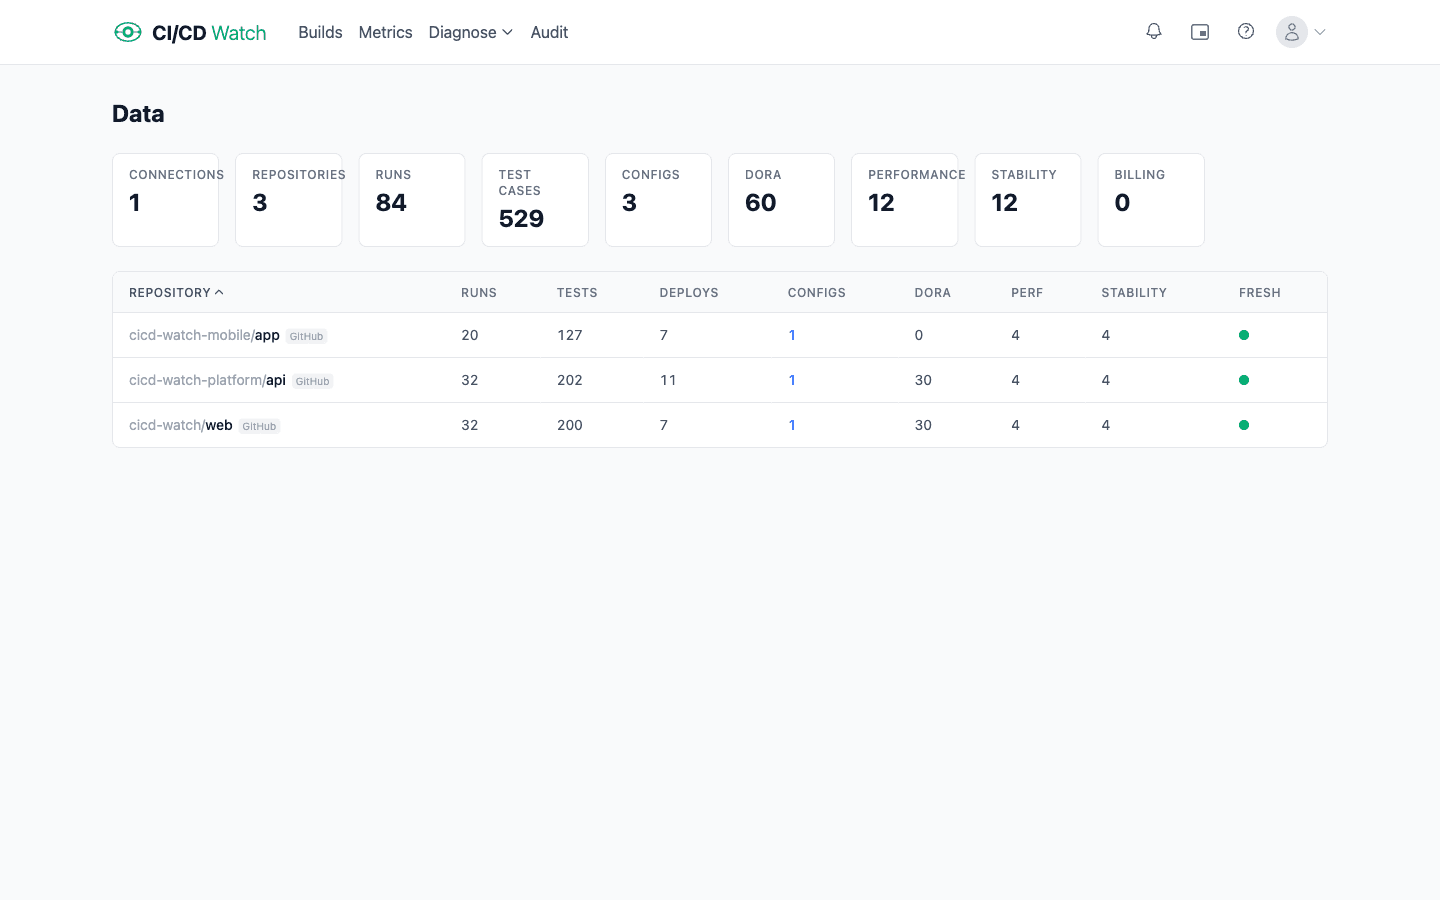
What the data view shows
Each row in the data view is one repository connected through your providers. Columns surface the repository name, run count, test count, deploy count, configured pipelines, and per-feature snapshot counts (DORA, performance, stability), plus a freshness timestamp showing the most recent sync. The combination is enough to spot repositories that are silent or stuck without digging through the builds list.
Sorting
Every column is sortable. Sort state lives in URL parameters (e.g. ?sort=repository&dir=asc), so a sorted view can be shared by URL. Default sort is by repository name, ascending.
Where to find it
Open Data in the app. The data view is most useful when investigating sync issues or confirming a newly-connected repository is feeding data into the platform. For configuring which repositories sync, see Connection Scope.