A platform engineer opens the GitHub Actions bill for the quarter. $5,400 across twenty repositories. It is high enough that Finance has asked for a breakdown. The engineer writes one, flags the obvious offenders (a nightly build running hot on macOS, a matrix strategy fanning out to twelve jobs when six would do), and ships a memo.
What the memo does not say is that the $5,400 is the most visible layer of what CI/CD actually costs the business. The larger costs never appear on any invoice.
More on CI/CD cost
Three layers of CI/CD cost
CI/CD cost sits in three concentric layers. Direct cost is what the provider bills plus what your team pays to wait. Organisational cost is the drag slow or flaky pipelines exert on the delivery feedback loop. Business cost is what that drag becomes in outcomes: features shipping later, defects reaching customers for longer, objectives slipping.
Most cost conversations stop at the first layer. Read together, the three tell you whether your team’s CI/CD practices are shortening the delivery feedback loop or quietly widening it. Developer wait time dominates the direct cost by more than an order of magnitude for most teams, and the direct cost in turn feeds through to the organisational and business layers underneath.
Direct cost: compute and wait time
The direct cost of CI/CD splits cleanly into two categories, and most teams account for exactly one of them. Compute is what the provider bills, arriving as a line item in Finance. Developer wait time is what salaries pay every minute someone is blocked on a pipeline. Both are real money. The order of magnitude between them is the thing teams tend to get wrong.
One smaller third line sits alongside: platform maintenance, the cost of keeping CI/CD itself running. It can dominate where teams run their own CI/CD infrastructure (Jenkins being the canonical case) and is usually absorbed into the platform team elsewhere.
Compute: what is actually billed
Every CI/CD provider bills differently, but the underlying model is similar: per-minute metering against a tier of included minutes, usually with a multiplier for runner type or operating system. GitHub Actions is the canonical example. Public repositories are free. Private repositories get included minutes tied to plan and then overage at $0.008 per Linux minute. Windows multiplies the rate by 2; macOS by 10. Larger runners bill at a higher per-minute rate. Self-hosted runners are free to GitHub, but you carry the infrastructure cost yourself.
GitLab CI, Bitbucket Pipelines, and CircleCI each run a variation on the same theme: included minutes, overage billing, OS or runner-size multipliers. GitLab applies a cost factor per runner type. CircleCI meters credits per minute per resource class. Bitbucket multiplies steps by a runner-size factor up to 32x.
Azure DevOps is a different shape: it sells parallel job slots at a flat monthly rate per concurrent pipeline rather than billing per minute, so cost scales with how many jobs you need to run at once, not how long they take. Jenkins is different again because it is self-administered by default: compute cost is whatever your infrastructure team spends on the hardware the agents run on, plus the time of the people who keep Jenkins itself running.
| Provider | Meter | Multipliers | Infra responsibility |
|---|---|---|---|
| GitHub Actions | Per minute | Windows 2x, macOS 10x, larger runners tiered | Provider hosts (self-hosted optional) |
| GitLab CI | Per compute minute | Cost factor per runner type and project type | Provider hosts (self-hosted optional) |
| Bitbucket Pipelines | Per minute | Runner size multiplier (1x to 32x) | Provider hosts (self-hosted optional) |
| CircleCI | Per minute (credits) | Resource class tiers the credit cost | Provider hosts (self-hosted optional) |
| Azure DevOps | Per parallel job | Microsoft-hosted vs self-hosted pricing tiers | Provider hosts (self-hosted optional) |
| Jenkins | Infra cost plus operator time | Whatever your hardware charges | Always self-hosted |
The shared theme across the per-minute providers is metering with a multiplier that punishes the wrong OS or oversized runner choice. The shared trap: cost increases that look like usage growth are often a misconfigured multiplier on a workload that did not need it. Azure DevOps hides the equivalent trap behind a different shape of bill: over-provisioned parallel slots rather than over-multiplied minutes.
Storage is the easy-to-miss line item inside compute. Artefact retention, log retention, test-result archives, and container registries accumulate every day and are rarely pruned. Teams that have never reviewed retention policies routinely find storage eating a non-trivial share of the monthly bill, and most providers charge for it on top of compute minutes.
From our own data
On a recent 30-day window of GitHub Actions runs across 378 terminal runs, the median compute cost per build was about $0.04. p95 was about $0.08. The average was $0.04 too. A small static-site workload averaged $0.01 a run; a medium SaaS test suite averaged $0.04; a larger app with a test matrix averaged $0.06. Compute itself is rarely the line item that surprises Finance.
Numbers from our writeup on cost per build, derived from 378 GitHub Actions runs over a 30-day window. Per-minute rates for other providers come from each provider’s public rate card.
Developer wait time: the invoice nobody sends
Here is the worked example that reframes the conversation. A platform team runs a 20-minute pre-merge pipeline. The team has 100 engineers. The fully-loaded cost of an engineer (salary plus benefits plus overhead) is $75 per hour, which is conservative for most markets. Each engineer pushes, on average, three commits per day that invoke the full pipeline.
20 minutes by 100 engineers by 3 commits per day by $75 per hour works out to $7,500 of wait time every working day. Across a 250-day work year that is roughly $1.9 million. The same workload on a GitHub-hosted Linux runner at $0.008 per minute costs about $12,000 per year in compute. The wait-time number is roughly two orders of magnitude larger than the compute number.
Plug in your own team size, the maths scales linearly:
| Team size | Annual wait time | Annual compute | Ratio |
|---|---|---|---|
| 10 engineers | ~$187,500 | ~$1,200 | 156x |
| 50 engineers | ~$937,500 | ~$6,000 | 156x |
| 100 engineers | ~$1,875,000 | ~$12,000 | 156x |
| 300 engineers | ~$5,625,000 | ~$36,000 | 156x |
Same 20-minute pipeline, same three-commits-per-day cadence, same $75 an hour fully-loaded developer rate, same GitHub Linux runner at $0.008 a minute. The ratio holds because both sides scale with engineer-count and pipeline-minutes the same way. Real teams sharing a single trunk see higher wait numbers than the linear projection, because more than one engineer is usually blocked on any given run.
The answer to “but developers context-switch while waiting, they do not really lose the full time” is that context-switching has its own well-documented cost: returning to deep work after an interruption takes roughly twenty minutes. Even if you cut the wait figure in half to account for partial productivity during waits, you are still more than an order of magnitude above the compute bill.
Wait time also hides in places that are not the pipeline itself. A pull request that sits for two days waiting for a human reviewer to merge it, because every earlier attempt hit a flake and nobody wants to kick the pipeline a fifth time, is common. Sequential pipeline stages that could run in parallel add wait time without adding compute. Runner queues during peak hours add wait time without adding compute. Deployment gates that require a manual approval add wait time without adding compute. Synchronous CAB-style approval forums add wait time on a different scale again, because every change is queueing for the same weekly slot. Per-change pen testing applies a high-cost gate uniformly, regardless of risk tier. Each of these costs the same hourly rate per engineer blocked, and none of them shows up on any provider invoice.
Wait time also feeds DORA metrics. Long pipelines lengthen change lead time: if you already measure lead time, you already measure a proxy for pipeline wait. The cost numbers explain why moving the metric is worth budget.
Waste categories: where the budget disappears
Once you accept the compute-plus-wait taxonomy, every waste category applies to both sides of the ledger. Each wasted minute is compute the provider billed and wait a developer paid. Five categories show up most often across customer workloads, and each compounds on both axes at once.
Reruns from flakiness. A flaky test fails, the pipeline reruns, the test passes, the team moves on. The cost is that the entire pipeline ran twice: compute doubled, wait time doubled. On a recent 30-day window of one of our own CI workloads, the rerun rate was 3.6%, roughly one commit in twenty-eight needing to be kicked again. Unchecked flakiness pushes that well into double digits, and every percentage point of rerun rate compounds with pipeline duration.
Oversized runners. Defaults are sticky. Teams pick a runner size early, never revisit it, and run the same workload on a 4-vCPU runner that would complete in roughly the same time on a 2-vCPU runner for half the cost. The inverse is also true: some workloads genuinely benefit from a larger runner, and paying for a faster pipeline buys back wait time across the whole team. Rightsizing is a measurement exercise, not a default choice.
Dead pipelines. Workflows that run on every push but nobody reads the results of. Nightly builds on branches nobody has merged in six months. Security scans that fail silently and alert nobody. Each is compute spent on a signal nobody acts on, and most dead runs sit on scheduled triggers because the team that set them up has moved on.
Red-main blocks. Main is red. The team cannot merge. Every engineer waiting on a merge is blocked; every engineer whose work depends on the broken feature is blocked on them. A single hour of red main on a 100-engineer team at $75 an hour is $7,500 of pure wait cost. The compute bill does not move; the wait bill is large.
Parallelism that does not parallelise. A matrix that fans out to eight jobs but one job takes fifteen minutes and the other seven take two minutes each gives you a fifteen-minute pipeline at 8x the compute. Real parallelism requires balancing work across jobs: sharding tests, splitting matrix dimensions that actually vary, or doing shared work once and fanning out only the part that benefits from concurrency.
When wait time beats compute, and when it does not
Wait time dominates compute when the team is non-trivial (ten or more engineers), pipelines gate merges, and pipelines take more than a few minutes. That is most teams. Compute wins in the edge case: a solo developer running heavy macOS builds can see the invoice exceed their own wait cost, because one engineer cannot wait more than one engineer’s hourly rate.
For everything in between, the back-of-envelope maths plays out in live data.
From our own data
On one CI workload over a 30-day window, we measured a 3.6% rerun rate across 165 terminal runs, with $7 of compute against $977 of developer wait time. That is a 142-to-1 wait-to-compute ratio on a workload the team considers healthy. Annualised, that is roughly $84 in compute and $11,900 in developer wait time on the same baseline.
Worked numbers in our writeup of flaky-test cost: the rerun share itself is small in absolute dollars ($0.16 compute, $25 wait), because reruns are short failed runs. Most of the wait cost lives in the healthy long runs.
Organisational and business cost
Compute and wait time are the localised costs: numbers you can attribute to a specific workflow run and a specific engineer’s calendar. Both end at the edge of the pipeline. The wider cost starts where the pipeline hands off to the rest of your delivery system, and it is where CI/CD moves from a Finance line item to a business concern.
Every software team runs on feedback loops. Commit to CI, CI to review, review to merge, merge to deploy, deploy to production signal, signal to customer response. The duration of each loop determines how quickly the team learns whether the last decision was right, and how quickly it can adjust the next one. A slow or flaky pipeline widens the loop closest to the commit, and every loop downstream inherits the delay.
This is the signal that DORA metrics measure. Change lead time, deployment frequency, change fail rate, failed deployment recovery time, and deployment rework rate are each a reading on how healthy a specific loop is. Elite-tier DORA teams move change-ready work to production in under a day; lower-tier teams take weeks. The pipeline is one of several contributors to the numbers, but it is the one visible at every commit, which makes it the lever most teams can actually move.
A slower feedback loop means slower learning. Features ship later. Defects reach customers for longer. Experiments take more calendar weeks to produce a verdict. Teams course-correct on bets that did not land after the competitor has already shipped the next bet. The business objective that depended on all of this (a revenue target, a customer-retention goal, a time-to-market commitment) slips proportionally, because the organisation could not complete the commit-to-customer loop quickly enough to meet it.
The DORA research is the most rigorous body of evidence for this link. High performers on the delivery metrics are also high performers on commercial outcomes, controlling for industry and size. The mechanism is the feedback loop: teams with tighter loops learn faster, ship more decisions per unit time, and recover from mistakes before they compound. This is why CI/CD cost, taken seriously, is not a Finance line item. The compute bill and the wait-time bill matter, but the figure that ultimately moves the needle is whether the delivery loop is fast and reliable enough to let the business make and verify decisions at the rate it actually needs to.
Reducing each: practices first, then tooling
The most expensive mistake teams make with CI/CD cost is treating it as a tooling problem. It is a practices problem first. Trunk-based development with small, frequent merges shortens debug time and shrinks each run’s batch. Fast, reliable tests remove the rerun tax. An always-shippable main removes the red-main category of wait cost. These are free; they cost discipline, not licence fees.
Tooling comes second. Once the practices are sound, tooling can compound the gains: selective test execution based on changed files, caching layers, rightsized runners, smart matrix strategies. The common thread is that every reduction on the wait-time side usually reduces compute too. A pipeline you make faster costs less in both categories. A flake you fix costs less in both. A dead pipeline you retire costs less in both. The numbers compound in the same direction.
Where to look first
If you are auditing cost for the first time, four numbers explain most of what you will find:
- p95 pipeline duration over the last 30 days. Wait time scales with p95 more than with median: the slow runs are what block the team. Trend it week over week.
- Rerun rate per workflow. A workflow that reruns often is paying double on both sides of the ledger and its reruns almost always trace back to a small number of flaky tests.
- Compute spend per developer per month.Normalising by team size strips out “the team grew” and exposes whether each developer’s cost has actually changed.
- Ratio of pipeline minutes on OS or runner-size multipliers. If a meaningful slice of your minutes runs on macOS or a 2x runner that does not need the extra capacity, the multiplier alone is a noticeable line item.
None of these numbers requires an expensive tool. They can be pulled from each provider’s API or billing export with a modest amount of scripting. The harder problem is keeping them current, and keeping them comparable across providers when a team runs more than one.
Where CI/CD Watch fits
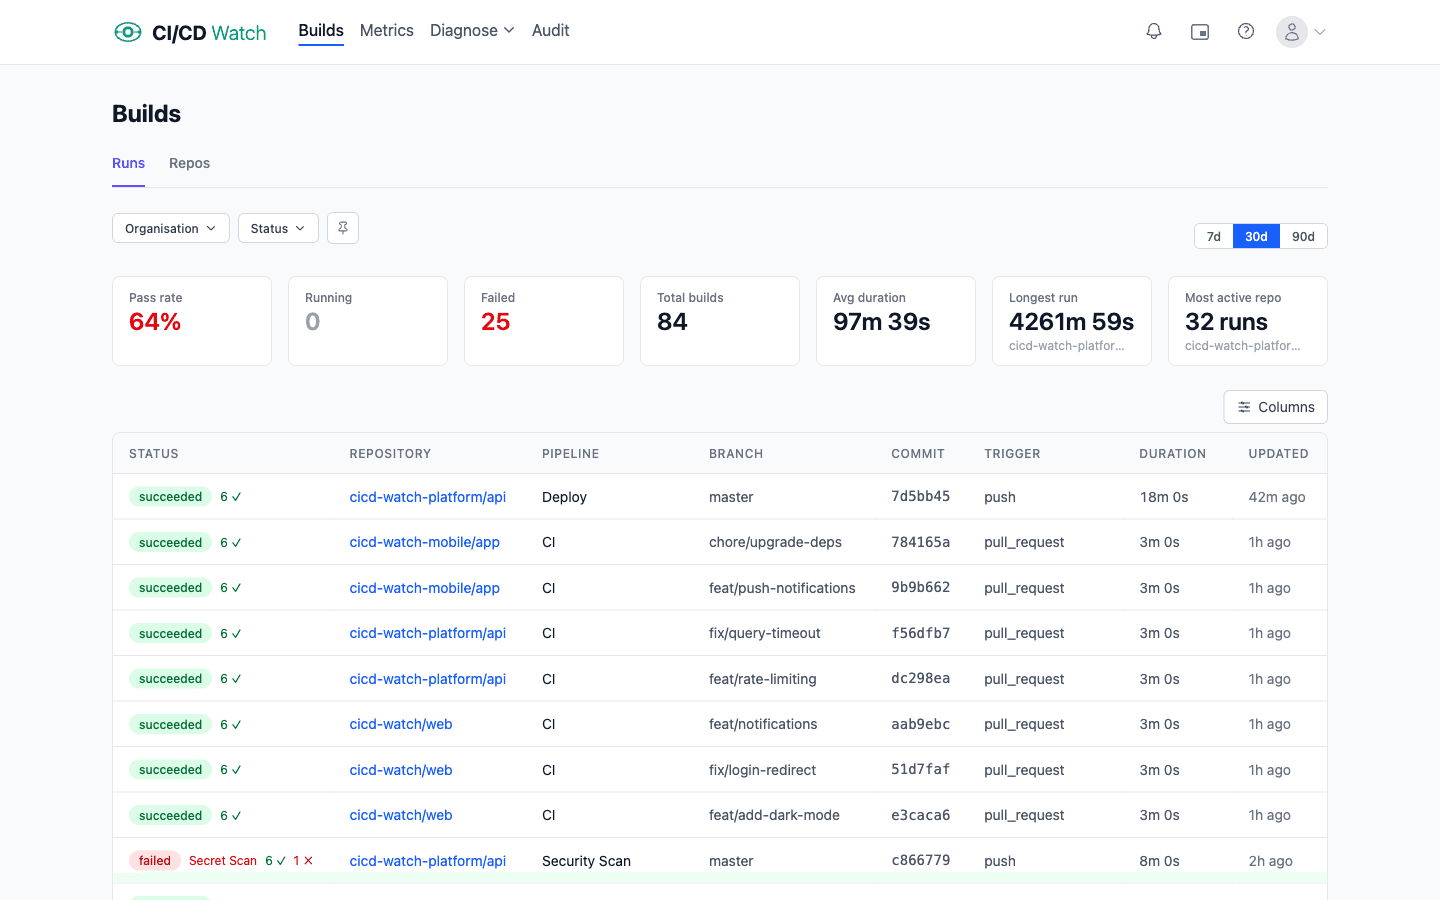
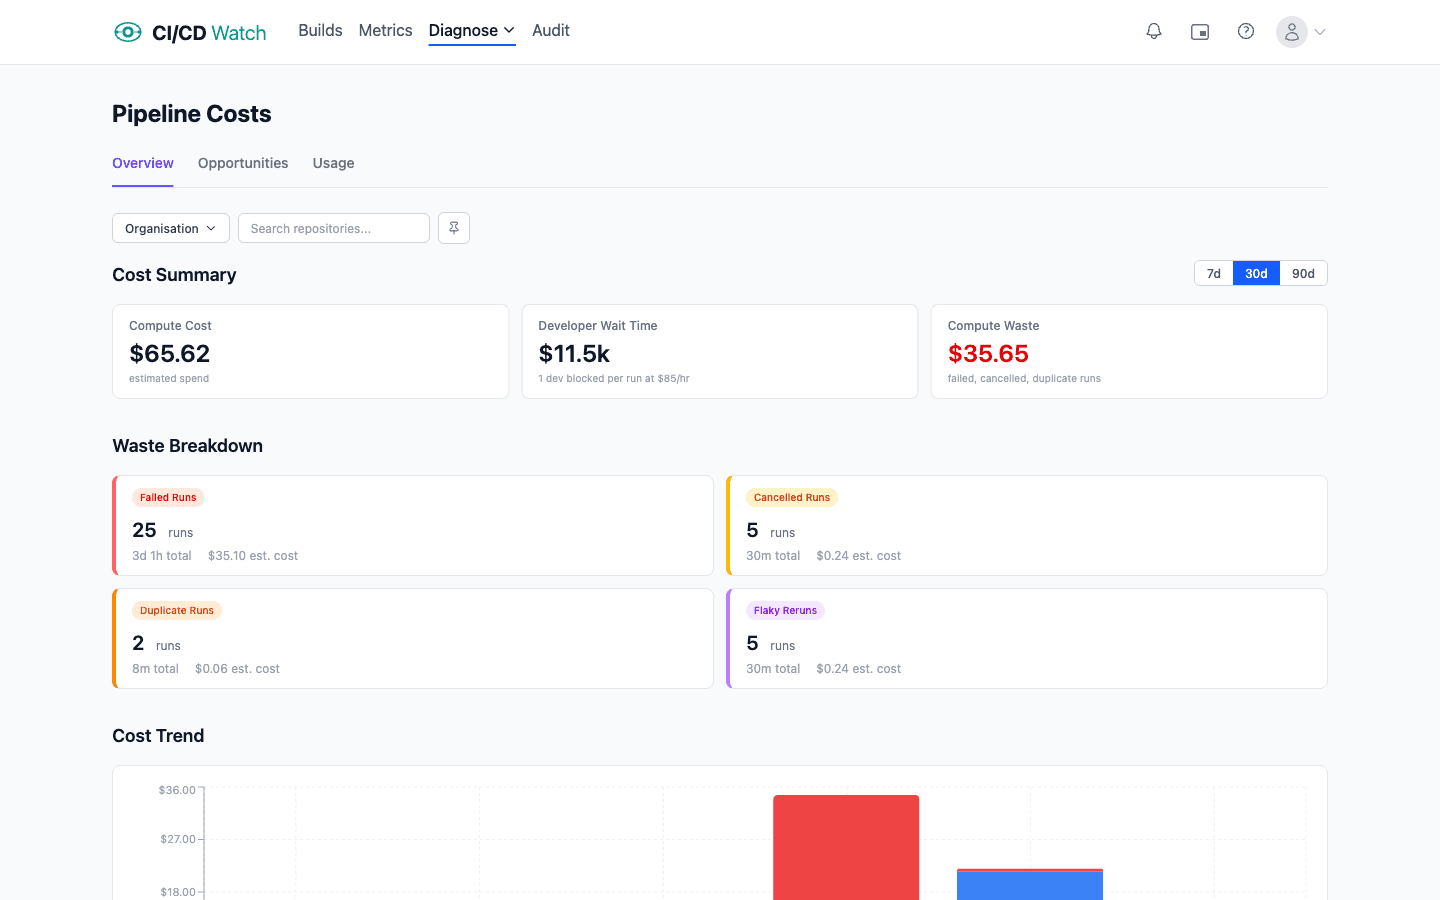
CI/CD Watch, a CI/CD observability platform that monitors pipelines across GitHub Actions, GitLab CI, Bitbucket Pipelines, CircleCI, Azure DevOps, and Jenkins, was built to make the compute-plus-wait model visible. The cost view starts from both components side by side, not the invoice in isolation.
Compute is computed from provider-reported billable minutes and the rate card for each runner type. Wait time is computed from pipeline duration and your team’s configured hourly rate, applied to the developer attached to the run. Both numbers roll up the same way: per workflow, per repository, per provider, across whatever time window you ask for. How the numbers are derived, including the configurable hourly rate and per-runner compute rates, is documented in the cost-calculations reference.
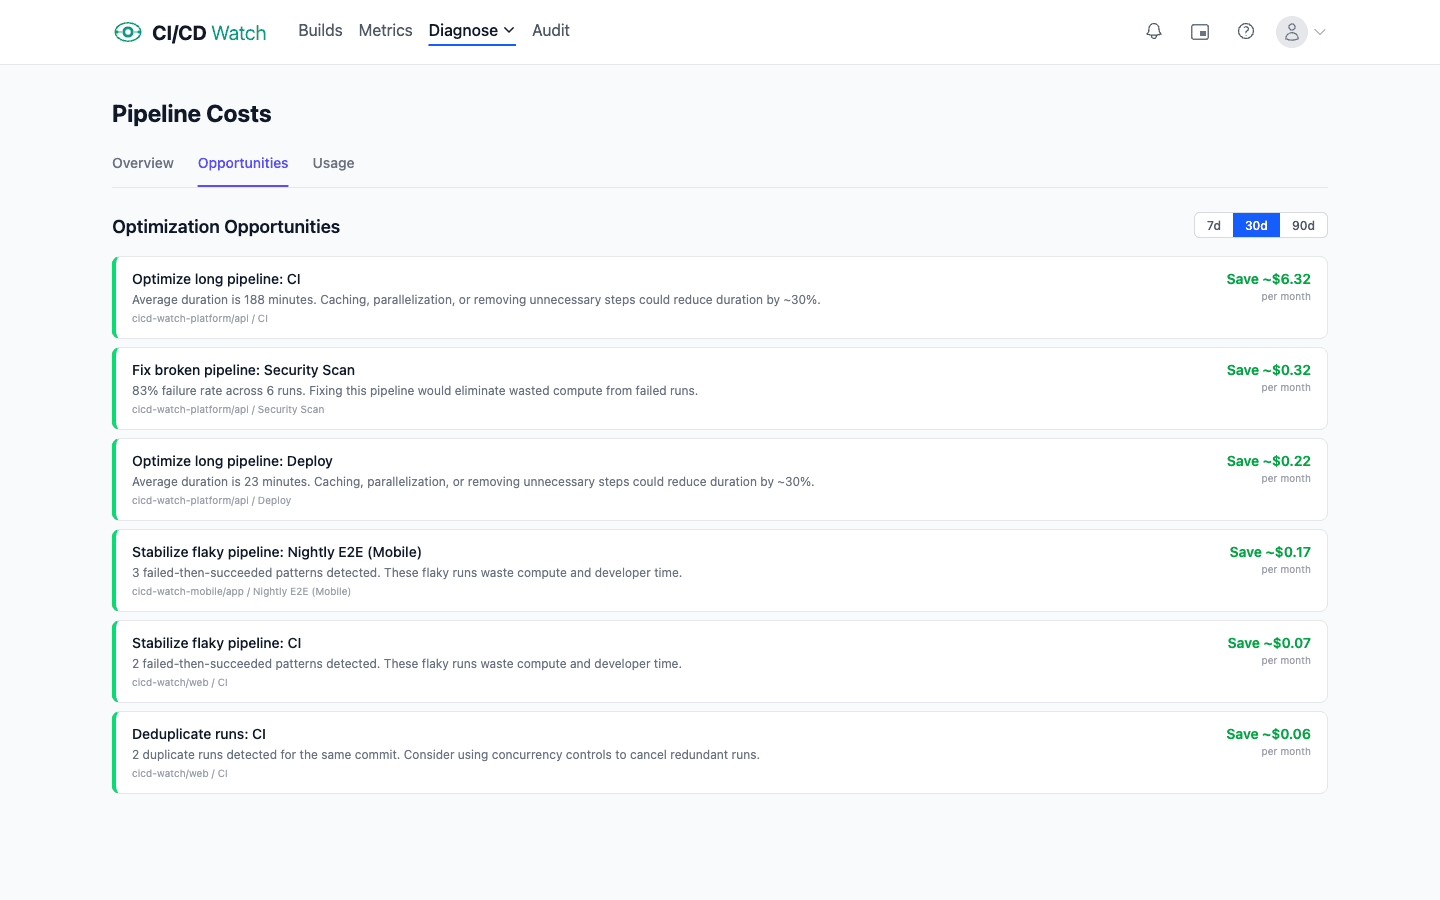
The waste categories have their own views: reruns driven by flaky tests, oversized runners relative to actual utilisation, dead pipelines (workflows with no human audience), red-main blocks, and parallelism gaps. Each is expressed as both a compute number and a wait-time number, so the argument for fixing any individual one is legible to both Finance and Engineering.
FAQ
- What does CI/CD actually cost?
- Two things on the direct line: compute the provider bills you, and developer wait time your salaries pay every minute someone is blocked on a pipeline. For most teams larger than a handful of engineers, the wait-time figure dominates the compute figure by roughly two orders of magnitude, because compute is metered in cents per minute and wait time is metered in dollars per minute.
- Why doesn't developer wait time appear on the bill?
- Because nobody sends an invoice for it. The provider charges for runner minutes, which lands in Finance's accounting. The cost of an engineer staring at a runs page, context-switching, or waiting for a flake-induced rerun is paid out of payroll and never gets attributed to the pipeline that caused it. Cost conversations that start with the invoice miss most of the money.
- How do I estimate developer wait time cost?
- Multiply pipeline minutes by engineers blocked per run by commits per engineer per day by their fully-loaded hourly rate. A 20-minute pre-merge pipeline, 100 engineers, three commits per day each, at $75 an hour, runs to roughly $7,500 of wait cost per working day. The arithmetic scales linearly with team size and pipeline length.
- What are the main waste categories in CI/CD spend?
- Five recurring offenders. Reruns driven by flaky tests, which double the cost on both sides of the ledger every time they fire. Oversized or wrong-OS runners, where defaults stuck early have never been rightsized. Dead pipelines that run on every push but nobody reads. Red-main blocks, where a broken trunk costs hourly until it's green. And parallelism that doesn't parallelise, where a matrix fans out compute but one slow job dictates wall-clock time.
- What does Azure DevOps cost compared to GitHub Actions?
- Different shape entirely. GitHub Actions, GitLab CI, Bitbucket Pipelines, and CircleCI meter per minute with multipliers for OS or runner size. Azure DevOps sells parallel job slots at a flat monthly rate per concurrent pipeline, so cost scales with how many jobs you need to run at once, not how long they take. Jenkins is different again because compute cost is whatever your infrastructure team spends on the hardware the agents run on.
- Should I optimise CI/CD cost as a tooling problem or a practices problem?
- Practices first, tooling second. Trunk-based development with small frequent merges keeps every pipeline close to its causing commit. Fast, reliable tests remove the rerun tax. A branching model that treats main as always-shippable removes the red-main category of wait cost. These are free, they cost discipline. Once the practices are sound, tooling compounds the gains through selective test execution, caching, rightsized runners, and smarter matrix strategies.
- How does CI/CD cost relate to DORA metrics?
- Wait time feeds change lead time directly. A slow pipeline lengthens the commit-to-production loop, which lengthens lead time, which lowers the team's DORA tier. Flaky tests add rerun overhead to lead time and change fail rate. Red-main hours extend recovery time. If you already measure DORA, you are already measuring proxies for pipeline wait, and the cost numbers explain why moving the metric is worth budget.
See the true cost of CI/CD
CI/CD Watch’s Free tier covers pipeline monitoring for small teams. Connect a provider and see every workflow run across every repository in one dashboard, with the cost view sitting alongside once you have a few days of data.