A deployment is any change that reaches production, and deployment frequency is how often those changes go out. Application code is the obvious case, but a config change, an infrastructure update, and a database migration are deployments too: if it alters what is running in production, it counts, and your tooling should record it as one. A change that lands behind a feature flag that is still switched off counts as well, because it has reached production even if no user can see it yet. Deploying is not the same as releasing, a distinction worth holding onto. Teams that count only their application-code deploys undercount badly, and the number they end up watching describes a fraction of what actually changes under their users.
The value of deployment frequency is as a proxy for batch size. Deploying often usually means deploying in small batches, because small changes are what can safely go out that frequently, and small batches are easier to review, test, and roll back. The proxy is not guaranteed. A flood of mass-generated code, AI-assisted work especially, can ship a large and sprawling change as a single deploy, so a healthy-looking cadence can still hide oversized batches. Two things have to hold for the number to mean what people assume it means: every kind of change is being counted, and the batches really are small.
It is also not a number to maximise. Once a team is deploying on demand, whether that is once a day or a hundred times a day, it is already in elite territory; the hundredth deploy buys nothing the first did not. Chasing a higher count is wasted effort at best and harmful at worst, because the ways to inflate it (empty redeploys, splitting one change across many releases) make the metric lie. Deployment frequency is a diagnostic, read alongside the other DORA metrics and never used to rank one team against another.
Deployment frequency is one half of the throughput pair inside the DORA metrics framework: the five throughput-and-stability metrics (deployment frequency, change lead time, change fail rate, failed deployment recovery time) plus deployment rework rate, added in the 2024 DORA Report. The other throughput half, lead time for changes, measures how long a change takes to ship. This post is the deployment-frequency half: what the metric measures, what counts as a deployment, what the performance bands actually mean, and how to improve it honestly rather than gaming the count.
What deployment frequency actually measures
Deployment frequency counts successful production deployments over a window. It is a throughput signal: how often the delivery system manages to get changes into production. On its own that sounds like a measure of busyness, and that is exactly the misreading the metric invites. What deployment frequency really tracks is batch size. A team that deploys many times a day is usually shipping small changes, because small changes are what can be deployed safely that often. A team that deploys monthly is shipping large batches, because a month of accumulated change is what each release contains. The word "usually" matters: the link between frequent deploys and small batches is strong but not automatic, and a single AI-generated change can be both large and shipped in one deploy, so the batch-size assumption is worth verifying rather than trusting.
That is why higher deployment frequency generally means lower risk rather than higher risk. Smaller batches are easier to review, easier to test, and easier to roll back when something goes wrong, because there is less in each one to reason about. Frequent deployment also shortens the feedback loop: the gap between writing a change and learning whether it works in production is measured in hours, not weeks. The number people sometimes reach for as a synonym, delivery throughput or release cadence, is pointing at the same underlying property. The question deployment frequency answers is not "how busy is this team?" but "how small and how shippable are this team's changes?"
What counts as a deployment
The type of change is not the question: code, config, infrastructure, and schema changes all count, because they all alter production. The question is how you detect that a change has actually reached production, and where you draw the line so that work which has not shipped is excluded. Get this wrong in the lax direction and the number inflates; get it wrong in the strict direction and you undercount real changes. Three candidate signals show up in practice.
A push or tag to main. The most generous definition, and the one that inflates the number fastest. Counting every tag push or every merge as a deployment treats code reaching the trunk as code reaching users, which it usually is not. A change can sit on main for days behind a release gate. This definition rewards activity that has not actually shipped.
A successful deploy-to-production workflow run. The pragmatic middle. A specific workflow, named and recognised as the one that puts code into the production environment, counts as a deployment when it succeeds. This is defensible as long as that workflow genuinely targets a customer-facing environment and not a staging slot that someone promotes from later.
Promotion through a gate to a customer-facing environment.The strictest and most truthful. A deployment is counted only when a change crosses the final gate into the environment real users hit. On estates with staging-to-production promotion this is the only definition that matches the metric's intent, and it is also the hardest to detect automatically because the promotion step is often a manual approval rather than a pipeline run.
The right answer is whichever signal aligns with a change actually reaching the production environment, and that varies by team, environment, and release process. What matters far more than the choice is consistency and coverage: pick one rule, document it, apply it the same way across every team and every window, and make sure it captures every path to production. The common failure is undercounting, tracking only the application-code deploy pipeline and missing the config changes, infrastructure updates, and schema migrations that also alter production. This is why deployment detection is best treated as configurable per service via deployment rules rather than assuming every workflow run is a deployment, or that only one workflow is. A different rule per team makes the cross-team number meaningless, and a rule that drifts over time makes the trend meaningless too.
Deploying is not releasing. One distinction sits underneath all three definitions. A deployment puts code into the production environment. A release exposes that code to users. With feature flags, trunk-based development, and dark launches, the two come apart on purpose: a change can land in production, fully deployed, while the feature it belongs to stays switched off until a separate release decision. Deployment frequency counts the deploy, not the release. That is deliberate. It measures how often the delivery system can safely get code into production, which is a property of the pipeline and the batch size, not of when product chooses to turn a feature on. Counting releases instead would fold a product decision into an engineering metric and tell you less about either.
What the performance bands mean
The DORA research sorts teams into four performance levels. For deployment frequency, Elite teams deploy on demand, multiple times a day. Lower-performing teams may only deploy monthly or less. The full band table, alongside the thresholds for the other four metrics, sits on the DORA metrics overview. The bands are deliberately wide, so within-band variance is noise: a team deploying eight times a day versus twelve is not meaningfully different, but a team deploying daily versus monthly absolutely is.
Three cautions about deployment frequency benchmarks. First, the bands are guideposts drawn from an industry distribution, not targets every team should sprint toward. A team shipping a regulated medical device has different constraints from a team shipping a consumer web app, and forcing the first into Elite cadence would be reckless. Second, comparing your team against that industry distribution is reasonable, but ranking your own teams against each other on this single number is not. Different services carry different risk and release constraints, so an internal league table on deployment frequency rewards the teams with the easiest deploys, not the best engineering, and invites the gaming covered below. Third, the bands describe the same delivery reality the other metrics describe. A team that hits Elite frequency while its change fail rate climbs is not Elite. It is fast and fragile, and the deployment frequency number on its own will not tell you that.
Why a higher number is not automatically better
Start with the ceiling. The bands top out at deploying on demand, so once a team is there, a higher count is not a higher score. Once a day and a hundred times a day sit in the same elite territory, and the marginal deploy beyond on-demand adds nothing to delivery performance. That is why chasing the number is futile, and why turning it into a target is worse than futile. Deployment frequency is exposed to Goodhart's Law, and the moment it becomes a goal it stops measuring what it was meant to. The failure modes are easy to spot: teams ship empty deploys that change nothing, redeploy an unchanged artefact on a schedule, or split one logical change across five releases to push the count up. A genuine config or infrastructure change is a real deployment and belongs in the count; these are no-ops dressed as activity, and the number rises while nothing new reaches production.
The deeper problem is that frequency read in isolation says nothing about whether the deploys are any good. Picture a team that pushes deployment frequency from weekly to daily, a fivefold throughput win on paper. If change fail rate climbs from 5% to 20% over the same period, the real result is more bugs reaching production, faster. Recovery work stacks up as incidents overlap, and developer time shifts from building features to rolling back and patching. The dashboard shows one number going up while the team is arguably worse off. Deployment frequency only means something when it is read next to lead time and the stability metrics, which is the whole reason DORA defines five rather than one.
How to improve deployment frequency
Because deployment frequency is a consequence of batch size and deploy safety, you raise it by improving those, not by deploying more for its own sake. The instinct to increase deployment velocity directly, by setting a deploys-per-day target, produces the gaming above. The practices that lift the number honestly are the same ones DORA has tracked since 2018, and the order matters.
- Shrink the batch. Smaller changes are what can be deployed safely and often. This is upstream of everything else: a team merging small increments has something shippable far more frequently than one integrating a fortnight of work at a time.
- Adopt trunk-based development. Long-lived feature branches batch change up by design and force big-bang merges. Merging to main daily, with features behind flags, keeps a deployable trunk and makes frequent deployment the natural state rather than an effort.
- Decouple deploy from release. Feature flags let a change ship to production minutes after merge without being visible to users. Deploys can happen continuously while the user-facing release schedule stays under product control, which removes the main reason teams hold changes back.
- Automate the deploy path. A deployment that needs a manual runbook and a quiet Friday afternoon will not happen often. A one-command or fully automated pipeline removes the friction that makes teams batch releases into rare events.
- Fix flaky tests before adding speed. A pipeline that needs a rerun to go green discourages frequent deployment more than any policy does. Stabilising the suite, covered in the cost of flaky tests, removes that drag.
None of these is a deployment-frequency lever in the literal sense. They are batch-size and safety improvements, and a rising release cadence is the signal that they are working. That is the right way round: treat deployment frequency as the diagnostic thermometer for delivery practices, not as the dial you turn.
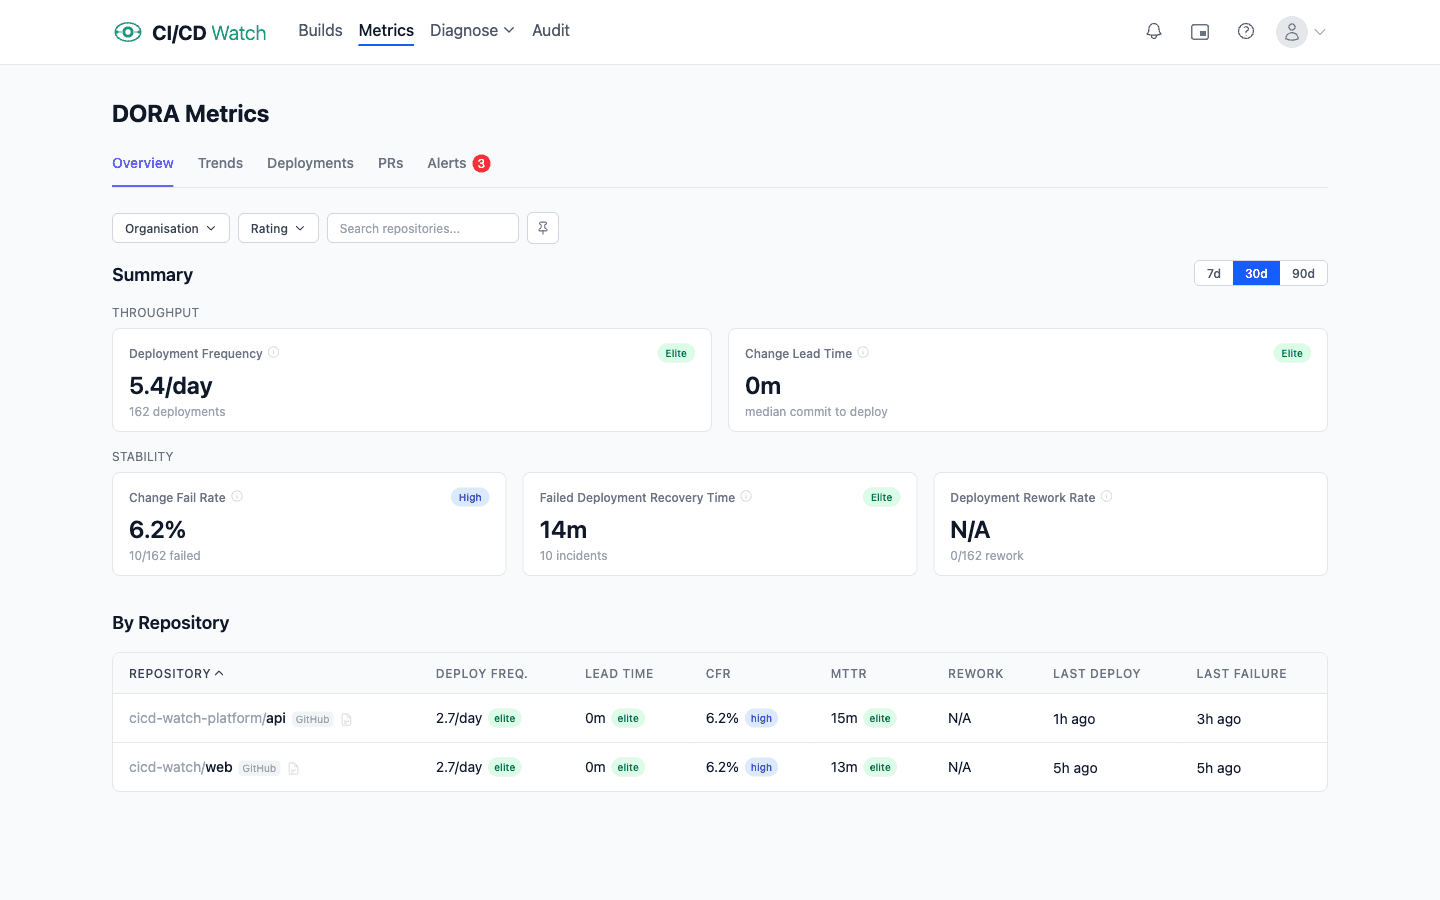
How CI/CD Watch surfaces deployment frequency
CI/CD Watch, a CI/CD observability platform that monitors pipelines across GitHub Actions, GitLab CI, Bitbucket Pipelines, CircleCI, Azure DevOps, and Jenkins, counts deployment frequency per repository against the deployment rule you define rather than treating every workflow run as a deploy. The rule names the workflow and the environment that count as production, so a build that only runs tests and a promotion that only reaches staging are excluded from the number. Because the rule is explicit and consistent, the trend stays comparable across teams and over time. How the rules are evaluated, including the chained-workflow case, is documented in the DORA metrics reference.
Deployment-frequency trends, and the Elite / High / Medium / Low band each repository falls into, sit on the Team plan and above. The Free tier covers pipeline-run monitoring, which is enough to confirm the upstream signals (run volume, average duration, deployment cadence) are coherent before layering DORA analysis on top.
See your deployment frequency across providers
CI/CD Watch's Free tier covers pipeline-run monitoring for small teams. Connect a provider to see deployment cadence and average duration across your workflows, the upstream signals the deployment-frequency calculation depends on. Deployment-frequency trends and the Elite / High / Medium / Low banding live on the Team plan and above. For the broader framework that deployment frequency sits inside, the DORA metrics overview covers all five, and how to measure DORA metrics works through the practical decisions you have to settle first.
CI/CD Watch is built by 3CS Technologies Ltd. It started as an internal tool for tracking pipeline health across a mixed GitHub Actions and Jenkins estate. The same engine now powers the SaaS platform.