A test passes locally, fails on CI, then passes on the rerun. The engineer logs it in their head as “flaky” and moves on. Three weeks later, on a different team, a test passes the first time, fails on the rerun, then fails on a third rerun before someone fishes out the flake list and sees it has been failing intermittently for two months. The test is quietly catching a real bug nobody is reading.
Both stories are “flaky tests.” Only one is actually noise. The other is a defect-detection mechanism the team is reflexively ignoring because it failed in the wrong rhythm. Both degrade pipeline stability in the same observable way: the run took longer, the verdict was unreliable, somebody clicked rerun.
Pipeline stability is the broader topic. Flaky tests are the most common manifestation, but the classification (healthy, flaky, broken) applies at the pipeline level too, and the fix patterns are the same regardless of which layer the instability lives at. What follows is the complete reference: what counts as stable and what does not, the six root causes that produce most flakiness in practice, the classification rubric, what JUnit reports tell you and what they do not, why rerun culture is a branching problem masquerading as a testing problem, and how flakiness scales with team size.
More on pipeline stability
What pipeline stability means
Pipeline stability is a classification across recent runs: healthy, flaky, or broken. It is a property of the distribution of verdicts, not the verdict of the last run. A pipeline that went green this morning can still be flaky if it failed intermittently last week, and one that failed today can still be healthy if the failure was a single data point in a long green streak.
The same three categories are used by the product and throughout this page. Healthy means passes consistently across the recent window. Flaky means mixed pass/fail with no clear cause from code changes. Broken means fails consistently, or no green run in the recent window. The classification is necessarily cross-run; a single failure is not a category, it is a data point.
Why this matters: the response differs by category. Quarantining a flaky test stops the rerun tax. Fixing or removing a broken test stops the false-confidence cost. Doing nothing about a healthy test leaves a working signal in place. Conflating the three (which is what “the test is flaky, just rerun it” quietly does) imposes the wrong response on each category.
What a flaky test actually is (and what it isn’t)
A flaky test produces different results on identical code, identical inputs, and the same test environment, without any meaningful change. The same test, run twice, gives different verdicts. Nothing else. That definition rules out three things teams routinely call “flaky” that are not, and naming the mode matters because the fix differs.
Three failure shapes that get misclassified as flake:
- A test that fails because of a real bug intermittently exposed. If the test catches a real defect that only manifests under certain timing or load conditions, the test is doing its job. The bug is the problem.
- A test that fails because of an environment difference.“Passes locally, fails on CI” is sometimes flake. More often it is an environment-specific assumption (DST, locale, file paths, env vars). Fix the assumption, not the test.
- A test that fails because the code changed. A test that goes red after a commit and stays red is broken, not flaky. Reverting and rerunning to see if it passes is misclassification, and the cost of that misclassification is real bugs reaching production.
Naming the mode is the first step in triage. Genuine flake means fix the timing, state, or dependency. Real bug means fix the bug and keep the test. Environment issue means fix the environment alignment. Broken test means fix the test or fix the code.
Why tests become flaky: the six root causes
Six root causes account for almost all flake we see in practice. The pattern across them is that flakiness is a contract violation between the test and something it depends on (a clock, a database, a network, a sibling test, a runner OS). The fix lives at the contract boundary, which is why pattern-matching to the right cause saves an hour of guess-and-rerun.
- Timing and async race conditions. A test waits for an event with a fixed timeout that is usually long enough but not always. Polling intervals that race with the operation under test. Async resolution that depends on event-loop scheduling. The fix is explicit synchronisation: deterministic clocks, awaiting on the actual completion signal rather than sleeping a guessed interval.
- Test order dependency and state bleed. Tests that pass when run in sequence A but fail when run in sequence B because shared state (singletons, DB rows, filesystem caches) leaks between them. The fix is per-test isolation: fresh fixtures, transaction-scoped DB state, tear-down that is honestly comprehensive rather than aspirational.
- External resource flakiness. Network calls to third-party APIs that occasionally time out. DNS lookups under load. Real database calls in a test that should mock them. The fix is moving the boundary: tests that exercise our code should not be on a network path that can fail for reasons unrelated to our code.
- Resource contention under parallelism. Tests that share ports, files, lock files, or database tables when parallelised. Pass single-threaded; fail when the runner spawns them concurrently. The fix is per-worker resource scoping: ephemeral databases per test process, dynamically allocated ports, isolated working directories.
- Non-deterministic data and unseeded randomness. Tests using
time.now()without a fake clock. UUIDs without a seed. Random sample selection that occasionally produces edge-case data the test was not written to handle. The fix is determinism: every random source seeded, every clock injectable, every UUID either stable or asserted by shape rather than value. - Environment-dependent assumptions. Tests that pass on macOS and fail on the Linux runner. Locale-dependent string comparisons. File-path separator assumptions. DST transitions on time-sensitive tests. The fix is portable assertions: write tests that pass on the machines they will actually run on, not the developer laptop they were authored on.
When a flake is reported, the useful first question is which of the six it is. The mode determines the fix.
Healthy, flaky, broken: a classification rubric
The same three categories apply at both the test level and the pipeline level. At the test level, ask whether a single test passes consistently across recent runs. At the pipeline level, aggregate up: flaky if jobs flip verdicts without tracking code changes, broken if failure rate is sustained, healthy otherwise.
| Category | Recent run pattern | What to do |
|---|---|---|
| Healthy | Passes consistently across recent runs | Nothing |
| Flaky | Mixed pass/fail with no clear cause from code changes | Triage and fix, or quarantine |
| Broken | Fails consistently, or no green run in the recent window | Fix the test or fix the code |
Per-test thresholds
For an individual test, three signals work together to draw the line between categories.
- Flip rate. The proportion of consecutive run pairs where the test changes verdict. Above 5% suggests flakiness; the higher the number, the more confident the classification.
- Failure rate over the recent window. Used together with flip rate. A test failing 90% of recent runs with low flip rate is broken; one failing 30% with high flip rate is flaky.
- Age of last green.A test that has not passed in two weeks is probably broken, regardless of flip rate. Time-bound the recovery window so old reds do not get classified forever as “just flaky.”
Per-pipeline thresholds
At the pipeline level the same logic applies, but the thresholds are tuned for the noisier aggregate signal. The CI/CD Watch classifier marks a pipeline as broken when its recent failure rate crosses 80%, as flaky when its flip rate crosses 30% and at least one failure has been observed, and as healthy otherwise. High-severity flaky pipelines are those flipping verdict on more than half their consecutive run pairs. The exact thresholds are documented in the pipeline-stability docs.
The reason to classify at both layers: a pipeline can be flaky because one specific test is flaky, in which case the fix lives at the test. Or it can be flaky because of infrastructure shared by many tests (a flaky runner image, an overloaded shared service), in which case no single test fix will help. The pipeline-level view tells you which problem you have.
Detecting flakiness with JUnit reports
JUnit-format test reports are the standard detection surface. Most CI providers parse them; most test runners across most languages produce them. A single JUnit report is a leaf-level signal: one run, one verdict. Flakiness detection requires aggregating across runs and applying the classification rubric. That aggregation is what most teams skip, which is why their flake list is anecdotal rather than measured.
What a JUnit report tells you per run:
- Test name, classname, and source file
- Status: passed, failed, error, or skipped
- Execution time
- Error message and stack trace on failure
- Captured stdout and stderr
What it does not tell you:
- Whether the test is flaky. One report is one run; flakiness needs the cross-run pattern.
- Flip rate or recent verdict pattern
- Which of the six root causes triggered the failure
- Test ownership: who should fix it
- Impact: which deployments depend on this test passing
A few JUnit traps worth naming, because they silently corrupt the cross-run analysis:
- Aggregation across matrix jobs. A matrix run produces N reports; deduping the same test across N reports needs a deterministic key, or one language matrix becomes N times the apparent test count.
- Skipped vs passed. Some test runners mark conditionally-skipped tests as passed. That contaminates the flip rate by counting skips as greens.
- Test renames. A renamed test loses its flake history if the cross-run join key is the test name. Tracking by stable identifier (file plus line plus name with rename heuristics) avoids resetting the data.
The rerun culture problem
The reflex to click rerun and hope is what turns a small flake population into a chronic problem. Rerun culture is downstream of three earlier choices, none of which is technical. Branching model, test ownership, and quality bar each push the team toward rerun as the default response.
- Branching model. Long-lived feature branches accumulate conflicts, which accumulates pre-merge runs, which accumulates rerun opportunities. Trunk-based development with small batches starves the rerun feedback loop of its main fuel.
- Test ownership.Without an on-call owner per test or per test suite, a flaky test is everyone’s problem and no one’s responsibility. Reruns are the path of least resistance; triage costs a person an hour. The economics push the team to rerun, every time.
- Quality bar.Teams that allow merges on a “rerun-once-and-it-passed” basis make rerun the default response. The flake rate climbs because triage gets deferred indefinitely. The bar drops, and once it drops it is hard to push back up.
Each of these is a practice change rather than a tooling change. None of them require purchasing anything. All of them are harder to enact than buying a flake-detection tool, which is why rerun culture is where most teams end up.
The cheapest single intervention: cap automatic rerun-on-failure. Some teams add it to their pipelines for resilience; that hides the rerun rate as a cost and lets it grow undisturbed. Cap it (one rerun, manual after that) and the signal stays visible. Visibility forces the triage conversation that the implicit cap was avoiding.
Why flakiness compounds with team size
The cost of flakiness rises faster than linearly with team size. That is the part most teams underestimate, and it explains why what looked manageable at fifteen engineers becomes a budget line item at a hundred. Linear effects (more runs, more reruns) are the easy part. Super-linear effects (shared trunk, coordination cost, review delay) are where the real money goes.
Linear effects:
- More engineers means more pipeline runs, which means more rerun opportunities, which means more compute and wait time billed.
- A 5% rerun rate on a 100-engineer team produces five times the absolute reruns of the same rate on a 20-engineer team.
Super-linear effects:
- A shared trunk means one flake blocks many. For a 100-engineer team at the standard $75/hr developer rate, an hour of red main is $7,500 of pure wait cost; the same flake on a 5-engineer team is $375.
- Coordination cost grows with team size. More PRs in flight means more reviewers waiting on flake triage, more downstream branches blocked on a single fix.
- Review delay compounds. A PR that fails CI repeatedly loses reviewer attention faster than one that goes green first time, and the merge slips by days, not minutes.
From our own data
On a CI workload we monitored over a recent 30-day window, the rerun rate was 3.6% across 165 terminal pipeline runs. Roughly one commit in twenty-eight needed to be kicked again. The team considered the workload healthy.
That same workload had a wait-to-compute ratio of 142 to 1: $7 in compute against $977 in developer wait time over the window. Across our other active CI workloads (at least 25 terminal runs in the window), rerun rates ranged from 0% on idle nightly suites to 5.9% on a busier monorepo CI. None looked alarming on rerun rate alone. The compute-to-wait-time gap is where the cost shows up.
Worked numbers in our flaky-test cost write-up.
Wait time is also what links pipeline stability to DORA metrics: long pipelines lengthen change lead time, and rerun-heavy workflows inflate it further.
Where CI/CD Watch fits
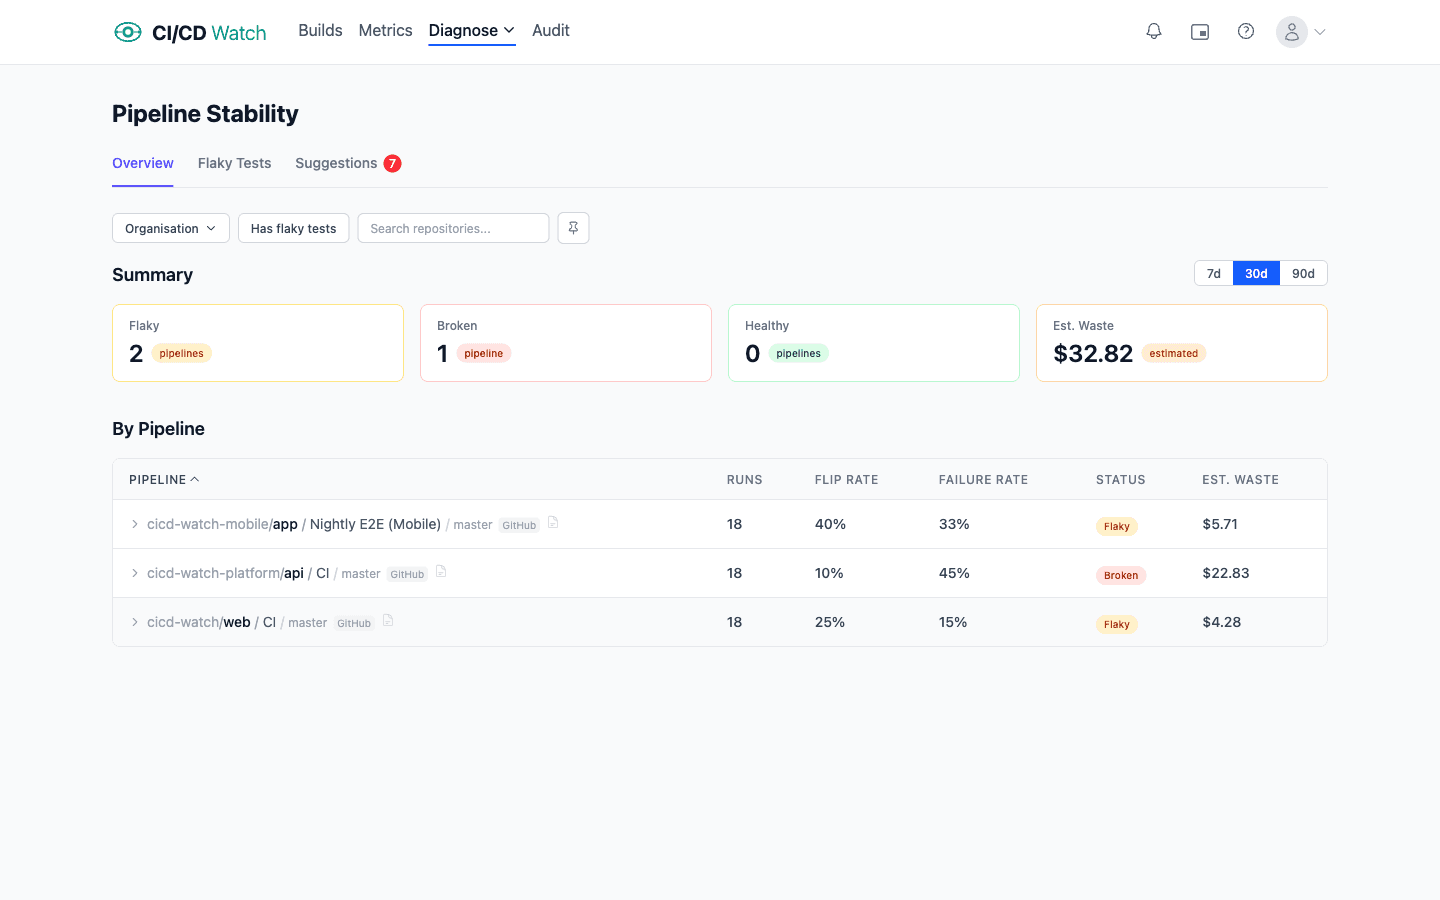
CI/CD Watch, a CI/CD observability platform that monitors pipelines across GitHub Actions, GitLab CI, Bitbucket Pipelines, CircleCI, Azure DevOps, and Jenkins, treats flakiness as the cross-run pattern it actually is. JUnit reports from each pipeline run feed into per-test history, and the classification rubric (healthy, flaky, broken) is applied automatically using the flip-rate and failure-rate thresholds described above.
Test-level detail surfaces which specific tests are driving the rerun rate. Workflow-level rollup shows which workflows carry the most flakiness, and which repositories sit on the worst end of the distribution. The classification updates each pipeline run; a test that was flaky last week and has gone green for the last twenty runs flips to healthy without a human in the loop.
Stability detection runs across all six providers. The JUnit parser handles the matrix-aggregation and skipped-vs-passed traps named above; tests are tracked by stable identifier so flake history survives renames. Provider-specific quirks (how reruns are attributed, whether matrix jobs rerun individually, how cancels are counted) live in the pipeline-stability docs and the flaky-tests docs.
Workflow-level rerun rate is on the Free tier, which is enough to know whether flakiness is a real problem on your CI estate. Test-level stability detail (which specific tests are driving the rerun rate, flip-rate distributions per repository, classification across healthy, flaky, and broken) sits on the Team plan and above.
Tooling compounds the practice gains; it does not replace them. The order of operations stays the same: branching and test ownership and quality bar first, quarantine the worst offenders second, classification and JUnit aggregation third. A rerun-tolerant culture pointed at better flake-detection tooling just spends more efficiently on a problem it should not have.
FAQ
- What is the difference between a flaky test and a broken test?
- A flaky test produces different results on identical code and inputs across consecutive runs. A broken test fails consistently across recent runs, or has no green run in the recent window. The distinction matters because the response differs: a flaky test gets triaged or quarantined; a broken test gets the test fixed or the code fixed. Conflating the two is what 'just rerun it' quietly does, and it imposes the wrong response on each category.
- Is a test that passes locally and fails on CI flaky?
- Usually not. 'Passes locally, fails on CI' is more often an environment-specific assumption (DST, locale, file paths, env vars) or a real bug that only manifests under CI's timing or load conditions. Fix the assumption or fix the bug. Genuine flake means the same test, run twice in the same environment on identical code, gives different verdicts.
- What are the six root causes of flaky tests?
- Timing and async race conditions. Test order dependency and state bleed. External resource flakiness (network, DNS, third-party APIs). Resource contention under parallelism (ports, files, databases). Non-deterministic data and unseeded randomness. Environment-dependent assumptions (locale, OS, paths). Each has a different fix, which is why naming the mode is the first step in triage.
- Should I auto-rerun failing CI jobs?
- Cap it. Some teams add automatic rerun-on-failure to their pipelines for resilience; that hides the rerun rate as a cost and lets it grow undisturbed. Cap it at one rerun, manual after that, and the signal stays visible. Visibility forces the triage conversation that the implicit cap was avoiding.
- How is a pipeline classified as healthy, flaky, or broken?
- Three signals working together. Flip rate (the proportion of consecutive run pairs where the verdict changes), failure rate over the recent window, and age of last green. A test failing 90% of recent runs with low flip rate is broken; one failing 30% with high flip rate is flaky; one passing consistently is healthy. The same shape of classification applies at the pipeline level using job-level metrics aggregated up.
- Why does flakiness cost more on bigger teams?
- Two reasons. Linear: more engineers means more pipeline runs, which means more reruns at the same rate. Super-linear: a shared trunk means one flake blocks many, and coordination cost (reviewers waiting, downstream branches blocked) grows with team size. At a 100-engineer team and the standard $75/hr developer rate, an hour of red main is $7,500 of wait cost; the same flake on a 5-engineer team is $375.
- What is the relationship between pipeline stability and DORA?
- Stability is upstream of every DORA metric. A flaky pipeline inflates change lead time (PRs get stuck behind reruns), inflates change fail rate (broken deploys reach production because the team learned to ignore red), and inflates failed deployment recovery time (the team lost trust in the signal). A team optimising DORA metrics without fixing stability is treating the symptom.
Start detecting flaky tests
CI/CD Watch’s Free tier covers pipeline monitoring for small teams. Connect a provider and see the rerun rate on every workflow you run, the entry point to the broader stability and cost picture.