Pipeline Stability
CI/CD Watch classifies every pipeline as healthy, flaky, or broken based on its run history. This gives you a quick way to spot unreliable pipelines and understand where your CI/CD system is wasting time and money.
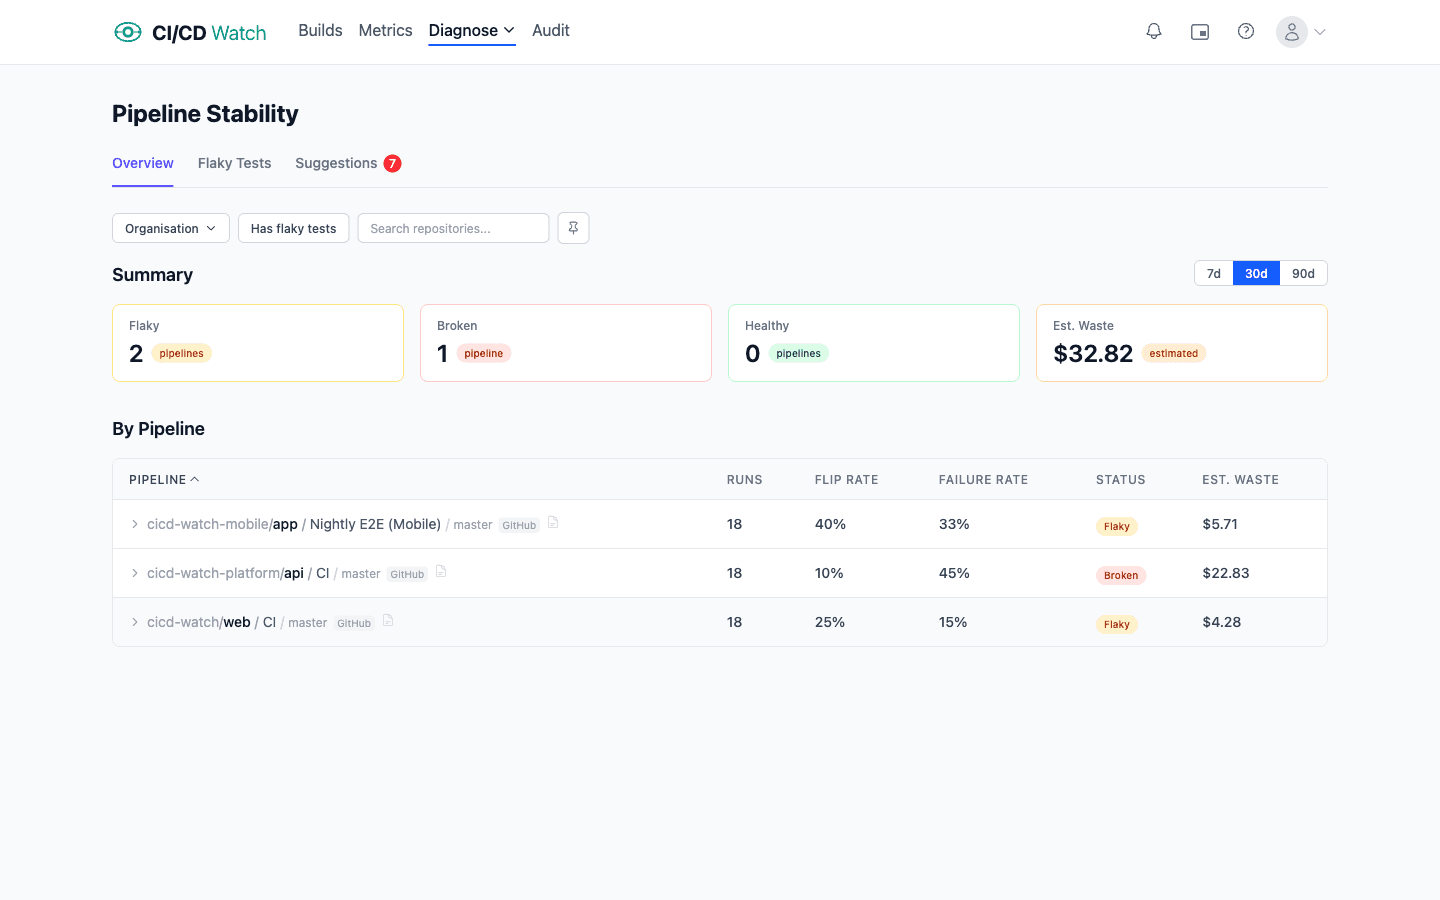
Classification
Each pipeline is classified using its failure rate and flip rate within the selected time window.
| Classification | Criteria |
|---|---|
| Broken | Failure rate ≥ 80% |
| Flaky | Flip rate ≥ 30% andfailure rate > 0% |
| Healthy | Everything else |
Flip Rate
What it measures:How often a pipeline's status transitions between passing and failing. A high flip rate means the pipeline is unpredictable, it passes one run and fails the next without any code change.
How it's calculated:The number of status transitions (pass → fail or fail → pass) divided by the total number of runs minus one. Only terminal statuses are considered, succeeded and failed. Runs that are still in progress, cancelled, or in any other non-terminal state are excluded.
flipRate = flipCount / (totalRuns - 1)Severity
Flaky pipelines are assigned a severity level to help you prioritize which ones to investigate first.
| Severity | Criteria |
|---|---|
| High | Flip rate ≥ 50% |
| Medium | Flip rate < 50% |
Job-Level Stability
Stability is also calculated per job within a pipeline. When a pipeline is flaky, the job-level breakdown helps you pinpoint exactly which job is causing the instability rather than investigating the entire pipeline.
Each job gets its own failure rate and flip rate, calculated the same way as pipeline-level metrics. This makes it easy to see if flakiness is concentrated in a single test job or spread across multiple stages.
Test-Level Stability
Beyond pipeline and job-level stability, CI/CD Watch tracks stability at the individual test level. The flaky tests page (under Stability → Flaky Tests) shows a sortable table of all tests with failures, including their failure rate, flip rate, total runs, and classification (healthy, flaky, or broken).
Expand any test to see its last failure details, error messages, stack traces, commit SHA, and a link to the CI run. This helps you diagnose flaky tests without switching to your CI provider.
Waste Impact
Flaky and broken pipelines waste both compute resources and developer time. Every failed run that didn't need to fail costs money in CI minutes and blocks a developer from getting feedback on their change.
The stability page shows the estimated cost of unreliable pipelines, combining compute charges and developer wait time. This helps you make a business case for fixing the pipelines that are costing you the most.
Related
- Flaky Tests , individual test stability tracking and classification
- Cost Calculations , how waste from unstable pipelines is quantified
- Performance Ratings , pipeline duration ratings and optimisation suggestions
- Deployment Detection , how deployment pipeline stability affects DORA metrics