Audit
CI/CD Watch audits every repository in your estate against a set of opinionated rules for pipeline hygiene. Each rule produces findings ranked by severity, with evidence pointing at the specific file, workflow, or step that triggered the check. Findings are surfaced in the audit view with a filter for the repos and rule categories you care about.
What we check
Rules span the practices a trunk-based delivery team would expect in every repo, grouped by theme. Some rules are presence-based (does the pipeline run the check at all?); others are signal-based (do the runs themselves indicate flakiness, waste, or process abuse?).
| Category | What we look for |
|---|---|
| Tests | Presence of unit tests, acceptance tests, build verification, type checking, accessibility scans, and schema-migration validation on the default branch. |
| Lint | A lint or static-analysis job that runs before merge. Recognises common formatters and linters across major language ecosystems. |
| Supply chain | Dependency vulnerability scanning (SCA), license scanning, secret scanning, and SAST presence. Pairs with Security Insights for repo-level coverage. |
| Workflow efficiency | Missing caching, missing parallelism, missing job timeouts, long-tail duration, shallow-checkout gaps, duration regressions, and disproportionate wait-to-compute ratios. |
| Flaky tests & reruns | Flaky jobs without retry, high-cost flaky tests, disabled tests left in the suite, quarantine candidates, newly-flaky tests to investigate, and waste from rerun loops. |
| Process hygiene | Force-push on protected branches, hotfix bypasses, [skip ci] on production paths, manual-approval inflation, and clustered manual reruns that signal a flaky pipeline. |
| Cost waste | Duplicate runs and developer-wait-time waste, surfaced as findings alongside the cost figure each one is producing. |
The rule set is expanded as new detection signals ship. See the roadmap for upcoming rules.
Severity tiers
Each rule emits findings at one of three severities. The tiers map to how strongly we recommend acting on the finding.
| Severity | Meaning |
|---|---|
| Blocking | A practice missing here meaningfully reduces delivery quality or security. Fix before adding scope. |
| Recommended | A widely-used practice that improves observability or feedback time. Worth doing in the next quarter. |
| Optional | A nice-to-have that may not apply to every repo. Track it but don't block on it. |
How findings work
A finding is a single rule result for a single repository at a point in time. Each finding includes:
- The rule that triggered, with a short description of the underlying practice.
- The repository and, where relevant, the workflow file or specific step the finding refers to.
- The severity tier (blocking, recommended, optional).
- Evidence: the file path, line number, or step name that produced the signal, so the finding is easy to verify or dispute.
Findings refresh on each sync cycle. A finding that disappears on the next run is treated as resolved.
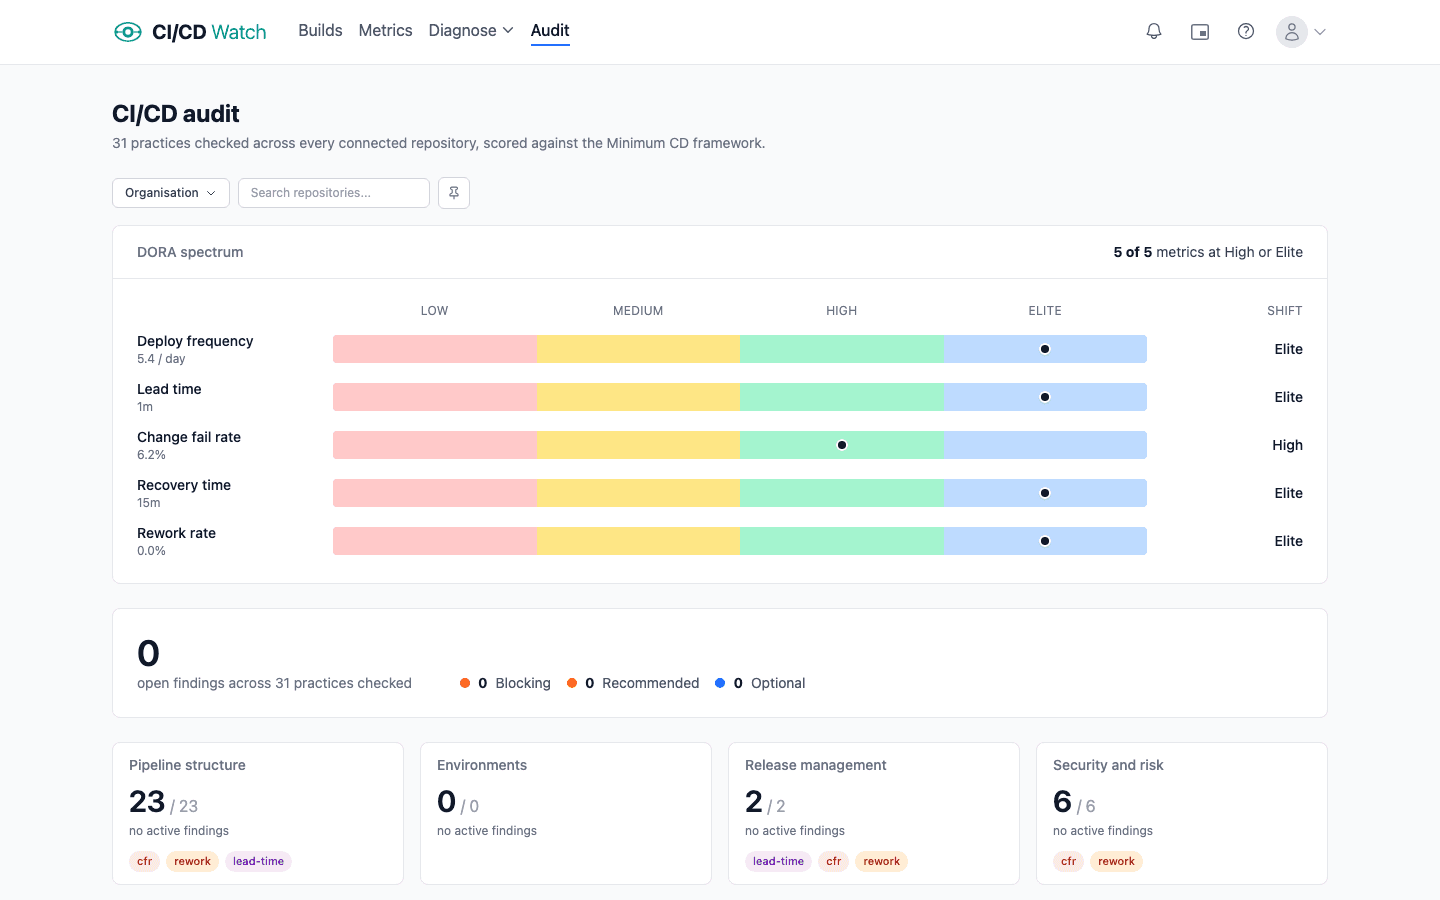
Viewing your audit
Open the Audit page in the app to see findings aggregated across every connected repository. Filter by repo, rule category, or severity. Drill into a single finding for the evidence and remediation guidance.
The audit is also exposed via the public API and MCP server, so the same findings can be piped into Slack, Linear, Jira, or your AI tooling.
Compliance mapping
Each audit rule is mapped to the compliance controls it produces evidence toward. A finding on a rule weakens the evidence for the controls it maps to; a clean run is evidence the control's practice is present. This is evidence toward controls, not an attestation— a clean audit is not a certification, and the pipeline evidences only part of any standard.
Two standards are mapped today: ISO/IEC 27001:2022 and NIST SSDF (SP 800-218). Both apply to any software pipeline. ISO 42001 and PCI-DSS are scope-conditional (they apply only to AI systems and cardholder-data environments respectively) and surface once a repository is declared in scope. Cost and efficiency rules carry no control mapping by design.
On the audit page, each finding shows the controls it maps to; mappings marked as partial are evidence toward a control without fully exercising it. Filter findings by standard with the Standard filter, and (on Business) see a per-standard coverage roll-up of how many mapped checks are clear.
The same data is available programmatically: the public API accepts a standard filter on /audit/findings and returns a controls array on each finding, and the MCP server exposes the same filter for AI tooling.
Availability
The audit page is available on every tier, with the starter ruleset enabled by default. Higher tiers unlock additional rules and per-org standard customisation. See pricing for the current tier breakdown.