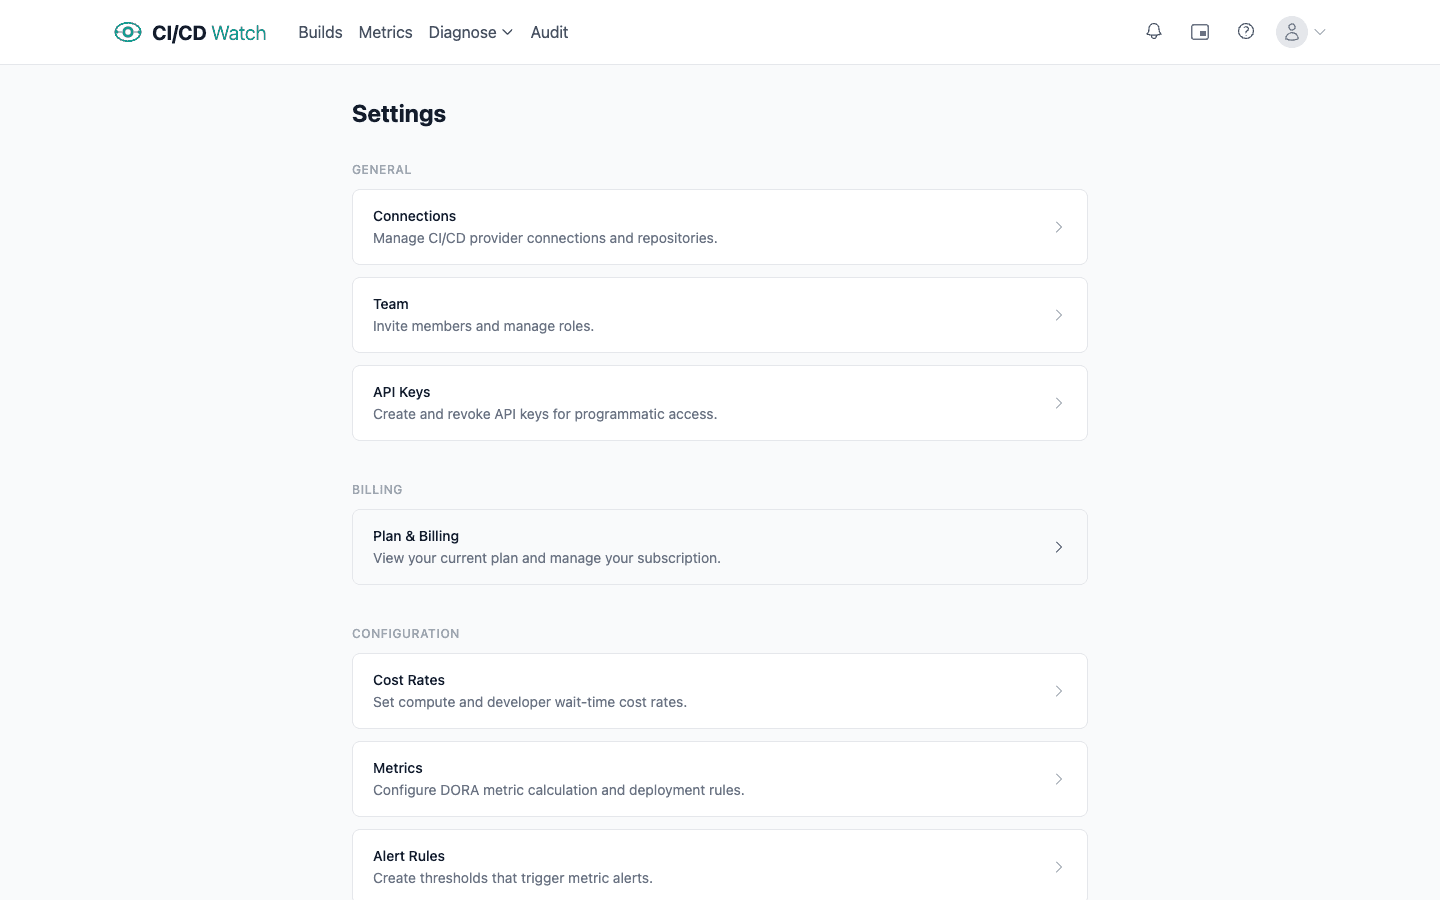
Settings
All configuration lives under Settings in the app sidebar. Settings are scoped to your team, changes apply to everyone in your organisation.
Only Admins and Owners can modify settings. Members have read-only access to dashboards and data but cannot change connections, cost rates, alert rules, or team membership. Changes take effect immediately, there is no separate publish step.
Team Members
Manage roles, invite members, and understand plan limits.
Connections
Connect CI/CD providers like GitHub, GitLab, Bitbucket, CircleCI, Azure DevOps, and Jenkins.
Connection Scope
Choose which organisations and repositories to sync for each connection.
Cost Rates
Customise currency, runner rates, and developer hourly cost for pipeline cost calculations.
Metrics Configuration
Fine-tune DORA metric calculations: exclusions, lead time measurement, MTTR settings, and rating thresholds.
Alert Rules
Set up alerts for significant changes in DORA metrics with warning and critical thresholds.
Notifications
Connect Slack, configure channel notifications, and set personal notification preferences.
API Keys
Create and manage API keys for the Public API, CLI, and MCP server.