Builds dashboard
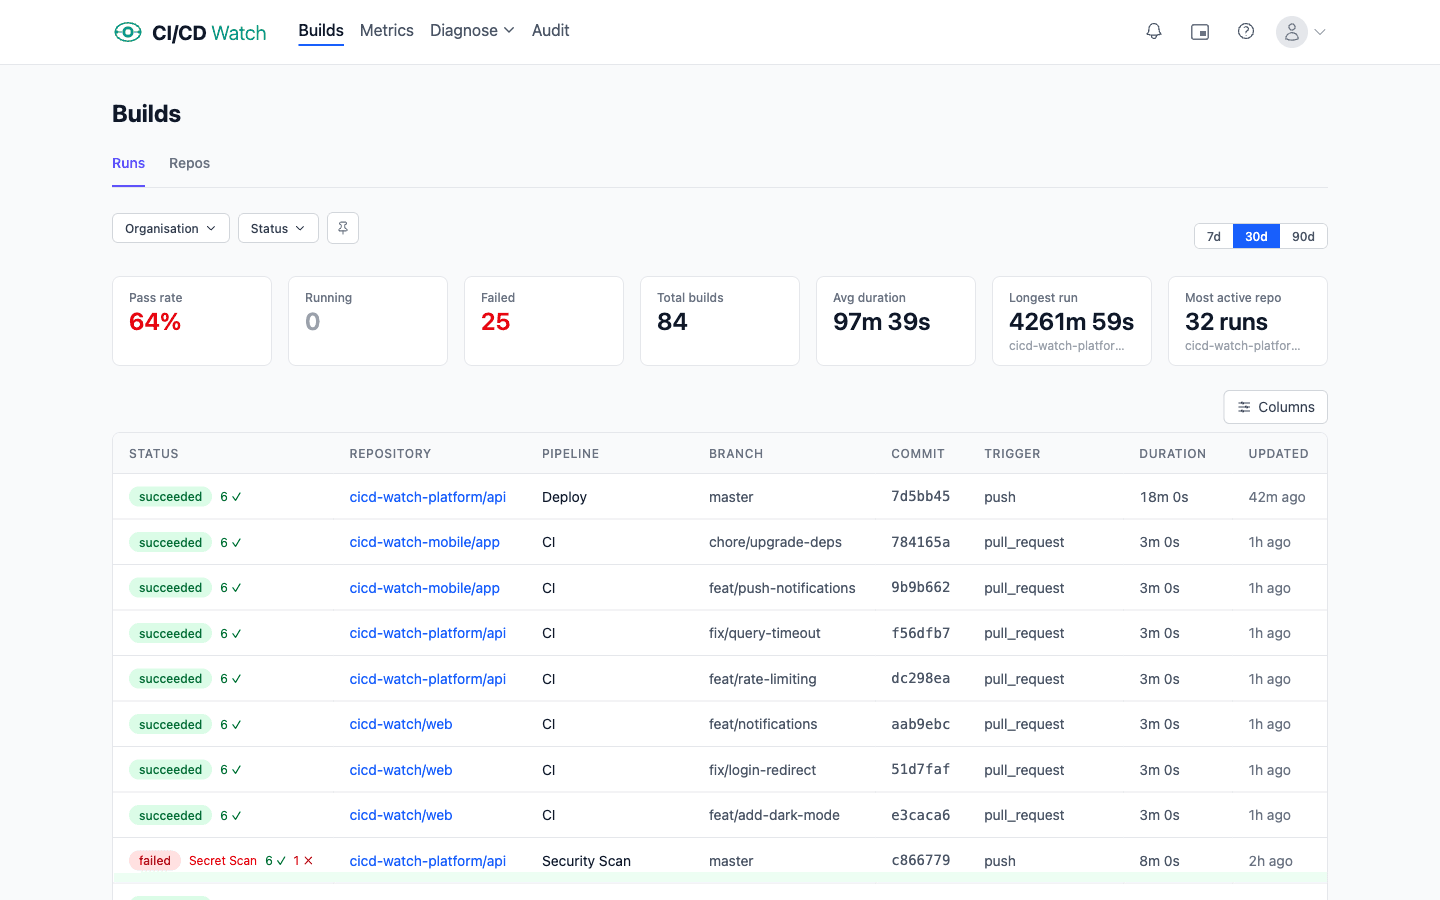
The builds dashboard is the main view in CI/CD Watch, and the surface most users land on after connecting a provider. It shows every pipeline run flowing through your connected providers, ranked by recency, with status, duration, repository, and branch surfaced at a glance.
What the dashboard shows
Each row is one pipeline run from one of the six supported providers: GitHub Actions, GitLab CI, Bitbucket Pipelines, CircleCI, Azure DevOps, and Jenkins. Columns include the workflow, the repository, the branch, the run status, the duration, and the trigger.
The header strip rolls up the totals for the current filter set: total runs, success rate, average duration, and a small set of comparison numbers against the previous equivalent window.
Filtering
Three filters control the view: time window (7, 30, or 90 days), organisation (drawn from the connected providers), and run status (running, succeeded, failed, cancelled, pending, queued, or unknown). Filters persist across page reloads via URL parameters, so a filtered view can be shared by URL or bookmarked.
Repos view
The Repos sub-view groups runs by repository, with an aggregated count, success rate, and average duration per repo. Useful when you want to spot which repos are running hot or quiet, or which repos have not synced recently.
Where to find it
Open Builds in the app. It is the default landing view for authenticated users with at least one connected provider. Before that, Connections and Connection Scope walk through the setup steps.